Visualization of Optimization Results in Real Time
This is a powerful addition to your MetaTrader 5 toolkit designed to optimize market analysis and performance. This Expert Advisor serves as automated trading software. It is utilized to monitor financial markets and execute trades based on predefined algorithmic rules, enabling precise position management without the need for constant manual oversight.
How to Setup and Use Visualization of Optimization Results in Real Time
1. Installation: Open the "File" menu, select "Open Data Folder," navigate to MQL/Experts, paste your file, and restart the terminal.
2. Activation: Drag the EA from the Navigator onto a chart, ensure "Allow live trading" is checked in the Common tab, and verify the AutoTrading button is green.
3. Optimization: Right-click your chart, choose "Expert List," click "Properties" to adjust inputs, and save your preferred setup as a set file for future use.
4. Maintenance: Regularly check the "Experts" tab in the terminal window to monitor trade logs and potential execution errors.
Frequently Asked Questions
Q: Why is my EA not opening trades? A: Check the "AutoTrading" button, ensure "Allow live trading" is enabled, and verify your broker allows automated trading on your account type.
Q: Can I run multiple EAs on one chart? A: No, each chart can only host one active EA; however, you can open multiple charts for different currency pairs to run several EAs.
Q: What does the "smiley face" icon mean? A: A smiley face in the top-right corner of the chart indicates the EA is successfully running; a frowny face means it is disabled.
Description & Settings
MetaTrader 5 Strategy Tester allows to get statistical parameters of a trading system after each testing pass.
Statistical parameters can be obtained using function, which is called inside and functions.
With the introduction of functions for working with optimization results (, , , and ), traders are now able to perform visual optimization. The necessary data now can be processed and displayed right during an Expert Advisor optimization or a mathematical problem solving.
We will consider the details of the example of visualization of an Expert Advisor testing results during the optimization described in the article .
1. Visualization of balance dynamics during the optimization
1.1. Downloading Files
Moving Averages_With_Frames.mq5 Expert Advisor should be copied to the terminal_data_folder\MQL5\Experts.
The following files are used for the Expert Advisor operation:
FrameGenerator.mqh - CFrameGenerator class for displaying optimization results;
SpecialChart.mqh - CSpecialChart class for drawing several balance charts;
SimpleTable.mqh - CSimpleTable class is a simple table having two columns;
ColorProgressBar.mqh - CСolorProgressBar class is a progress bar using two colors.
They should be copied to the terminal_data_folder\MQL5\Include.
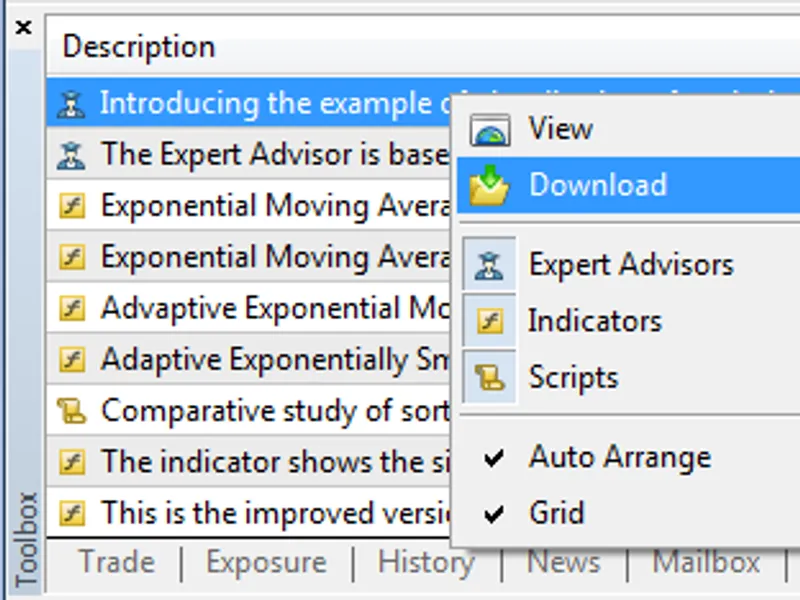
Code Base programs can be downloaded automatically via MetaTrader 5 terminal (CodeBase tab of the "Toolbox" window). To do this, select "Download". All codes will be downloaded and placed in their folders.
Fig. 1. Downloading CodeBase programs via MetaTrader 5 terminal
1.2.
Testing the Expert Advisor
Moving Averages_With_Frames.mq5 Expert Advisor should be launched in the Strategy Tester.
Test settings:
Fig. 2. Moving Averages_With_Frames.mq5 test settings
Optimization options:
Fig. 3. Moving Averages_With_Frames.mq5 test settings
During the optimization the Expert Advisor displays the balance dynamics and optimization pass statistical data:
Fig. 4. Moving Averages_With_Frames.mq5 optimization
Optimization process:
1.3.
The Expert Advisor Operation Principle
Moving Averages_With_Frames.mq5 Expert Advisor is created based on Moving Averages.mq5 one included in the standard MetaTrader 5 terminal package (MQL5\Experts\Examples\Moving Average).
The following code has been added for the results visualization:
This code can be similarly used in any Expert Advisor.
CFrameGenerator class is used for working with optimization results. The class contains the methods for handling the Strategy Tester events (, , , ) and the method for chart events (). Used graphical objects are prepared in OnTesterInit() method of CFrameGenerator class.
OnTester() method of CFrameGenerator class is invoked on a test agent after each test pass. This method provides calculation of the balance curve dynamics based on trading results. Balance curve chart is a one-dimensional array, the length of which depends on the number of performed deals.
Then, function is used to request statistical data (net profit, profit factor, recovery factor, number of trades, number of deals, maximum funds drawdown percentage, custom optimization criteria value) and a frame (test pass data array, in our case) is generated, which is sent to the terminal (from the test agent) using function.
Frames are received and handled in OnTesterPass() method of CFrameGenerator class. Frames read operation is performed by function. Request for the Expert Advisor input parameters, for which the frame has been generated, is performed using function.
After obtaining the data, it is displayed and updated using CSimpleTable, CColorProgressBar and CSpecialChart classes methods.
It should be noted that OnTester() handling functions execution is performed
on the test agent
after another current optimization pass has been finished. This allows the use of distributed network capacities to carry out complex mathematical calculations. To do this, place the calculation part to OnTester event handler.
The example of using the optimization for accelerating mathematical calculations (continuous wavelet transformation of the ) is shown in the topic .
2. Examples of Working with CSimpleTable, CColorProgressBar and CSpecialChart Classes
Attached Test_SimpleTable.mq5 and Test_CSpecialChart.mq5 scripts contain examples of working with CSimpleTable, CColorProgressBar and CSpecialChart classes. They should be copied to the terminal_data_folder\MQL5\Scripts.
Fig. 5. Test_SimpleTable.mq5 script operation result
Fig. 6. Test_CSpecialChart.mq5 script operation result