Display optimised for console-type chart text output
This is a powerful addition to your MetaTrader 5 toolkit designed to optimize market analysis and performance. This library provides a collection of modular, reusable code. It is utilized by developers to organize common functions, allowing for the integration of complex logic across multiple Expert Advisors, indicators, or scripts without the need for code duplication.
How to Setup and Use Display optimised for console-type chart text output
1. Storage: Place library files in the MQL/Libraries directory to ensure they are accessible to your projects.
2. Implementation: Include the library in your code using the #import directive, ensuring you match the exact function names and parameters.
3. Compilation: Ensure the library is present in the directory before you compile your main EA or script, as the compiler links them during this phase.
4. Management: Keep libraries organized in sub-folders if you manage many custom functions to maintain a clean project structure.
Frequently Asked Questions
Q: What is a library file used for? A: Libraries store reusable code modules, allowing you to centralize common logic used by multiple EAs or indicators.
Q: Is a library executable? A: No, libraries are non-executable files containing functions; they must be imported into an EA, indicator, or script to function.
Q: Can I update a library while the platform is running? A: You should compile your EA or script after updating a library to ensure the latest code changes are integrated.
Description & Settings
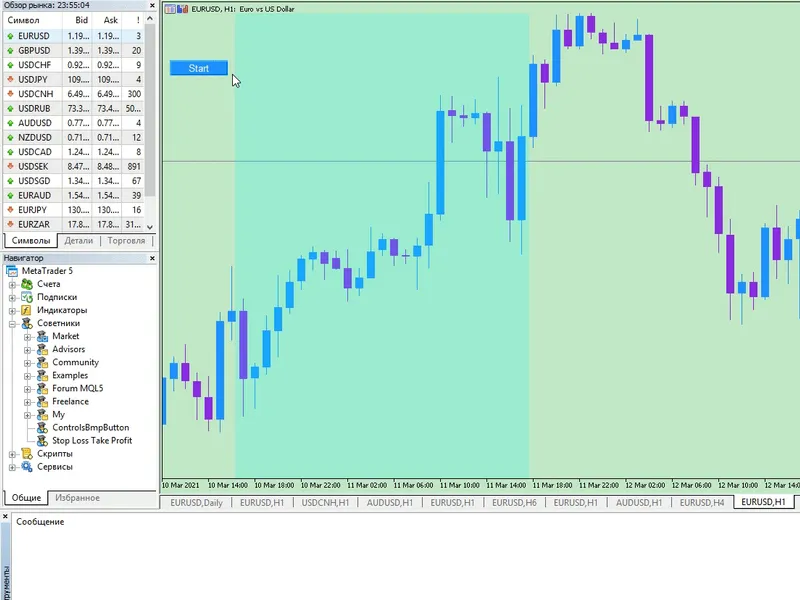
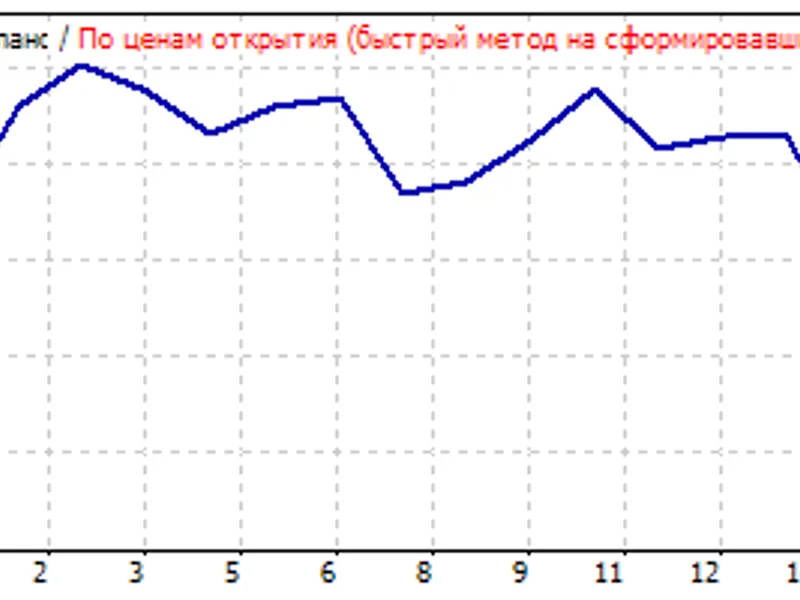
The library contains two types of displays. The first, LabelsDisplay, is based on CChartObjectLabel. The second, CanvasDisplay, is based on CCanvas. The displays are optimised for rendering frequency. Besides the main Expert Advisor demonstrating the work of displays Demo.mq5, there are two more variants, CanvasVsLabelsTester.mq5, to perform measurements exclusively in the tester, on ticks. And the universal CanvasVsLabels.mq5, which performs measurements both in the tester and on the chart. These measurements can be compared with each other. For more details on comparing the speed of displays, please see the link .
To update the top line, you need to call the setText method of the class you are using. To shift the text to the line below, the push method of the used class is called . And to display the added/updated text on the display use the update method of any of the classes. In addition to this method, the LabelsDisplay class has an additional method updateOne, which can speed up the display more than 2 times. It is called only when the top line needs to be updated. If the push method was called, then after it you should call the update method instead of updateOne .
Input parameters
outType
- display type
nLines
- number of lines on the display
optimiseUpdate
-
optimize
for Labels
bWidth
- width of the display
lY_Dist
- distance between lines
back
- background for Labels
With
outType
you can select the display type from
Canvas
or
Labels
values. The
nLines
change sets the number of lines that will be saved after scrolling by the push method. The
optimiseUpdate
parameter enables economical updating of only one line, if the push method has not been called and therefore the rest of the lines do not need to be updated (see above). With
bWidth
you can set the width of the display (relevant for Canvas and Labels using background). With the
lY_Dist
parameter you can achieve the desired font size. The font size is taken from
lY_Dist
, from which the part set by the fDec coefficient is subtracted, which allows to change the real line height, not the font size, without taking into account the distance between lines. The
back
parameter enables the background in
Labels
mode
.
Thus, it is possible to display information in the chart in 5 different modes.
Canvas
Labels
Labels with optimised textoutput
Labels with Canvas background
Labels with background, plus, optimisation
Using a background in outType
:
Labels mode gives about the same load as using other additional chart objects. That is, it slightly increases the time it takes to output text to the display.
You May Also Like
MT4 Experts

MT4 Indicators


MT5 Experts


MT5 Indicators
-
 Bars and Rates Information Utility, displays how many bars there are in all timeframes for any user selected symbol, and shows the 'Copy Rates' information availablity for any bar
-
 MA Price display
-
 Series Integer Info and Rates Bar Information Utility, displays how many bars there are in all timeframes for any user selected symbol, and shows the 'Copy Rates' information availablity for any bar