PS A R Zigzag (Non lagging)
This professional-grade solution for MetaTrader 5 helps traders achieve greater efficiency in their daily workflow. This technical indicator acts as a specialized analysis tool designed to visualize market data. It helps traders identify emerging trends, momentum shifts, and key support or resistance levels by plotting statistical calculations directly onto price charts.
How to Setup and Use PS A R Zigzag (Non lagging)
1. Installation: Place your file in the MQL/Indicators folder via "Open Data Folder" and restart your terminal.
2. Loading: Find the indicator in the Navigator, drag it onto your chart, and configure the input parameters in the popup window.
3. Customization: Press Ctrl+I to open the indicator list, select your tool, and click "Properties" to change colors, levels, or visual styles.
4. Updating: Replace the old file in the Indicators folder with the new version and restart the platform to apply changes.
Frequently Asked Questions
Q: Why is my indicator not showing? A: Verify the file is in the MQL/Indicators folder, or try right-clicking the "Indicators" tree in the Navigator and clicking "Refresh."
Q: Do custom indicators slow down the platform? A: Too many complex indicators can impact performance; remove unused ones via the "Indicator List" (Ctrl+I).
Q: Can I use MT4 indicators on MT5? A: No, MQL4 and MQL5 are distinct languages; ensure the indicator is compiled specifically for your platform version.
Description & Settings
This indicator differs from the traditional zigzag you're already familiar with. The traditional zigzag serves a different purpose: it primarily highlights previous market swings and delays by the necessary number of bars before confirming the next swing. It works based on price action. A lagging and repainting indicator is not intended to detect real-time signals. The zigzag drawing is less commonly used in trend-following indicators. It is more commonly used to analyze historical pivot points in a market to predict future price movements.
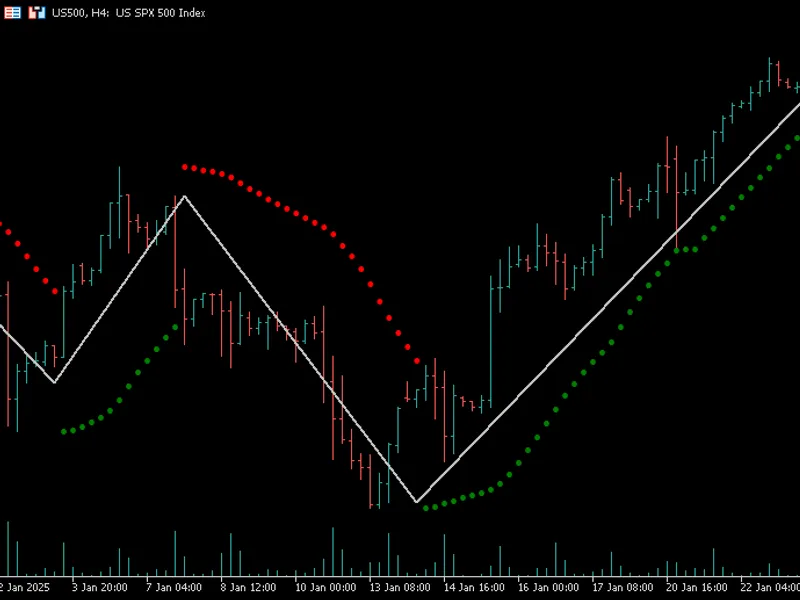
This zigzag is something else entirely. It's a dynamic, trend-based zigzag with no lag up to the current bar. I base it on the SAR trend, which is a trend-following algorithm with no lag. Trend-following zigzags have been developed in the past, including one based on the PSAR, but they were delayed and produced invalid legs. Why have a lagging zigzag based on a non-lagging trend-following algorithm? This didn't seem logical to me. That's why I created this, because I think we should have a zero lag zigzag drawing.
A backstep is used to keep the legs valid. When searching for a high, it will find the highest high from the number of lookback bars defined in the backstep input, and will find the lowest low when searching for a low by the same number of lookback bars defined by the backstep figure. This means that the end of the segment will sometimes swing at the high or low, or at most recent support or resistance.The PSAR is known to struggle in ranging markets, and this is a shortcoming of it. Otherwise, it's quite a decent trend-following indicator. This zigzag structure is the most relevant part of the code. It was designed to be clean, efficient, and maintainable. I hope you appreciate the work and experimentation.