Volume Oscillator
This tool for MetaTrader 5 is specifically engineered to streamline your trading operations. This technical indicator acts as a specialized analysis tool designed to visualize market data. It helps traders identify emerging trends, momentum shifts, and key support or resistance levels by plotting statistical calculations directly onto price charts.
How to Setup and Use Volume Oscillator
1. Installation: Place your file in the MQL/Indicators folder via "Open Data Folder" and restart your terminal.
2. Loading: Find the indicator in the Navigator, drag it onto your chart, and configure the input parameters in the popup window.
3. Customization: Press Ctrl+I to open the indicator list, select your tool, and click "Properties" to change colors, levels, or visual styles.
4. Updating: Replace the old file in the Indicators folder with the new version and restart the platform to apply changes.
Frequently Asked Questions
Q: Why is my indicator not showing? A: Verify the file is in the MQL/Indicators folder, or try right-clicking the "Indicators" tree in the Navigator and clicking "Refresh."
Q: Do custom indicators slow down the platform? A: Too many complex indicators can impact performance; remove unused ones via the "Indicator List" (Ctrl+I).
Q: Can I use MT4 indicators on MT5? A: No, MQL4 and MQL5 are distinct languages; ensure the indicator is compiled specifically for your platform version.
Description & Settings
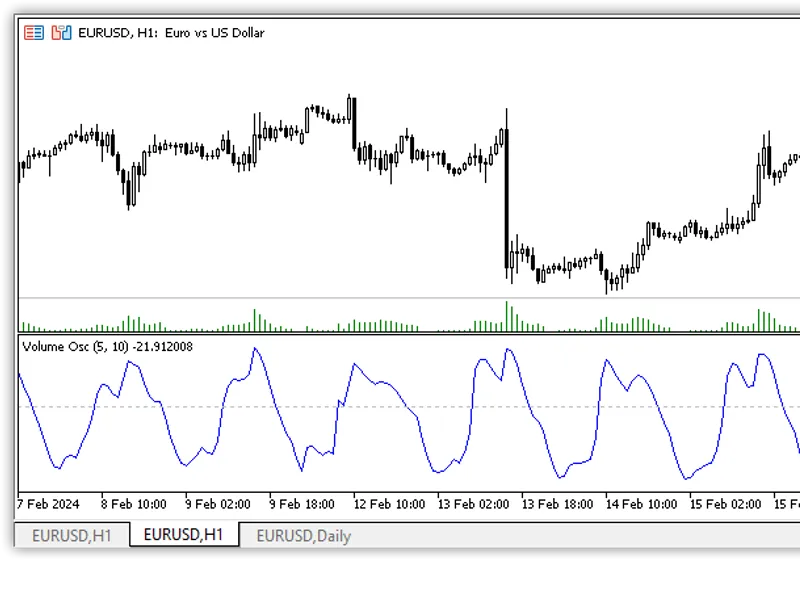
Volume Oscillator is the ratio of two moving averages calculated on volume.
Calculation:
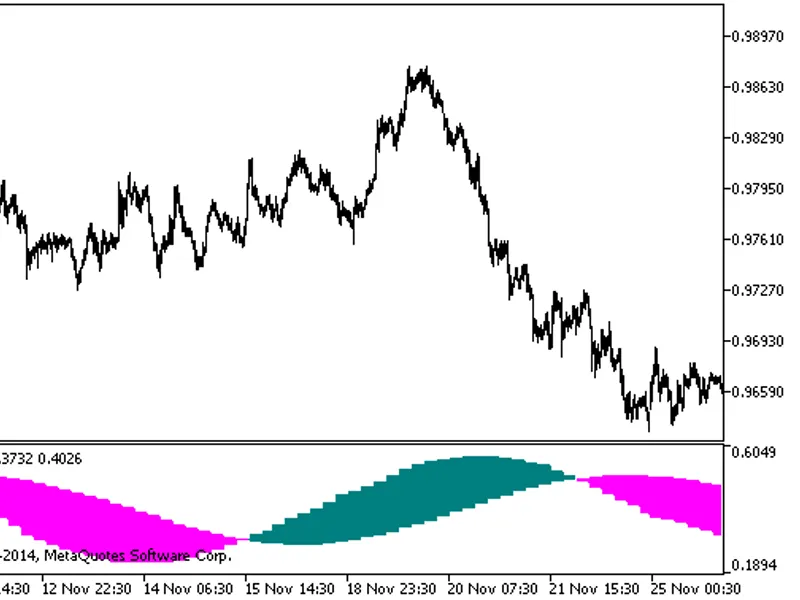
A rise or fall in price along with an increase in volume can potentially signal the strength of a trend. In this case, if the volume oscillator is above the zero line, it can be a confirmation of price direction and market trend, whether the market is in an uptrend or downtrend. A rise or fall in price along with a decrease in volume could potentially signal trend weakness. In this case, if the volume oscillator is below the zero line, it could signal that the price direction and overall market trend is weak.
Divergences in the negative area of the oscillator can often signal that a trend reversal could potentially occur in the near future. The indicator line fluctuates between above and below the zero line, which gives an indication of the price trend and whether the movement is strong or weak. Positive values of the oscillator suggest that there is sufficient market support for the price to continue its current trend direction. Negative values suggest that there is no market support, indicating that the price is stagnant or hinting at a trend reversal.