Exp 3rd Generation XM A
This tool for MetaTrader 5 is specifically engineered to streamline your trading operations. This Expert Advisor serves as automated trading software. It is utilized to monitor financial markets and execute trades based on predefined algorithmic rules, enabling precise position management without the need for constant manual oversight.
How to Setup and Use Exp 3rd Generation XM A
1. Installation: Open the "File" menu, select "Open Data Folder," navigate to MQL/Experts, paste your file, and restart the terminal.
2. Activation: Drag the EA from the Navigator onto a chart, ensure "Allow live trading" is checked in the Common tab, and verify the AutoTrading button is green.
3. Optimization: Right-click your chart, choose "Expert List," click "Properties" to adjust inputs, and save your preferred setup as a set file for future use.
4. Maintenance: Regularly check the "Experts" tab in the terminal window to monitor trade logs and potential execution errors.
Frequently Asked Questions
Q: Why is my EA not opening trades? A: Check the "AutoTrading" button, ensure "Allow live trading" is enabled, and verify your broker allows automated trading on your account type.
Q: Can I run multiple EAs on one chart? A: No, each chart can only host one active EA; however, you can open multiple charts for different currency pairs to run several EAs.
Q: What does the "smiley face" icon mean? A: A smiley face in the top-right corner of the chart indicates the EA is successfully running; a frowny face means it is disabled.
Description & Settings
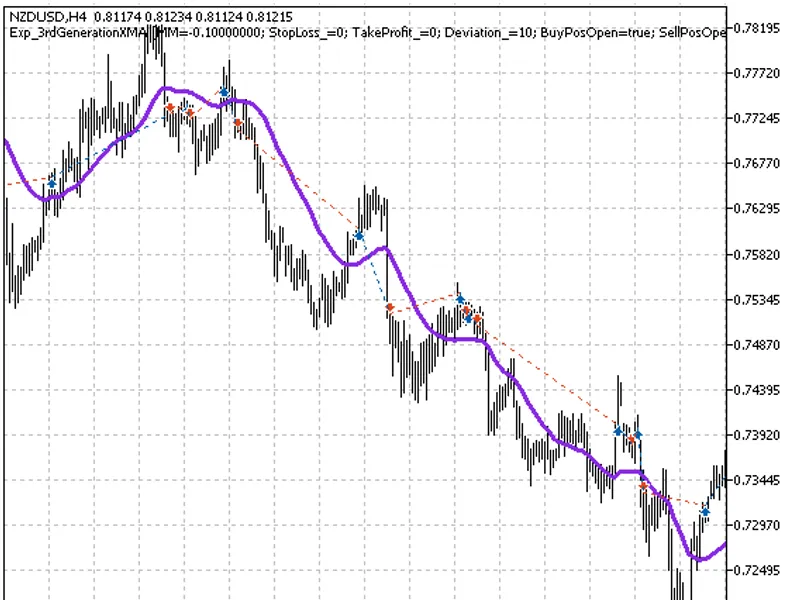
The Exp_3rdGenerationXMA Expert Advisor is based on the change in the moving average direction. A signal for a transaction forms when a bar is closing, provided that the MA direction has changed.
Proper operation of the generated Expert Advisor requires the compiled indicator file 3rdGenXMA.ex5 to be placed in terminal_data_directory\MQL5\Indicators.
Tests shown below were run using the default input parameters of the Expert Advisor. Stop Loss and Take Profit were not used during the tests.
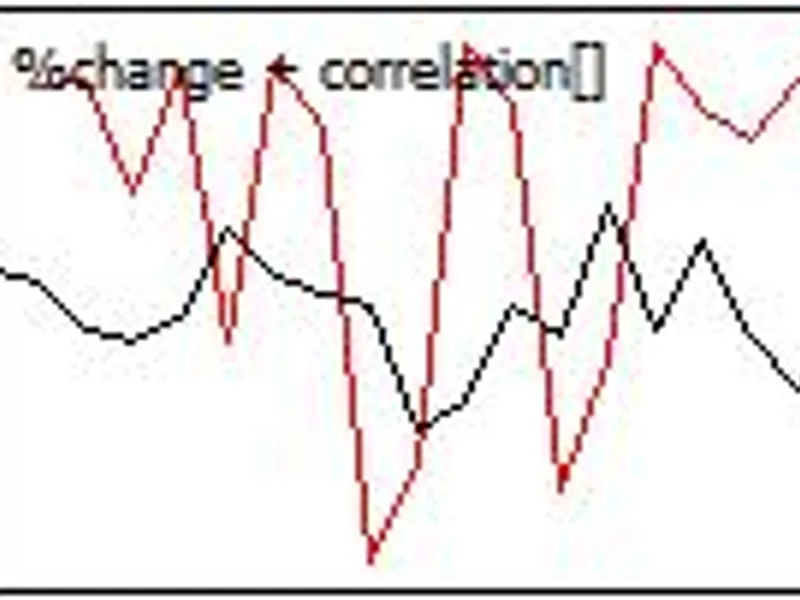
Fig. 1. Examples of transactions in the chart
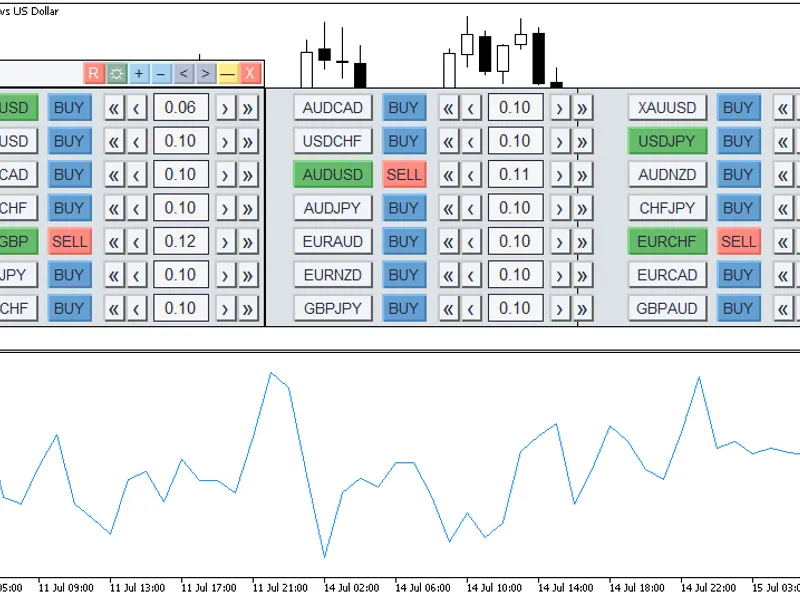
Testing results for NZDUSD H4 over 2011:
Fig. 2. Testing results chart