Correlation Calculator Panel
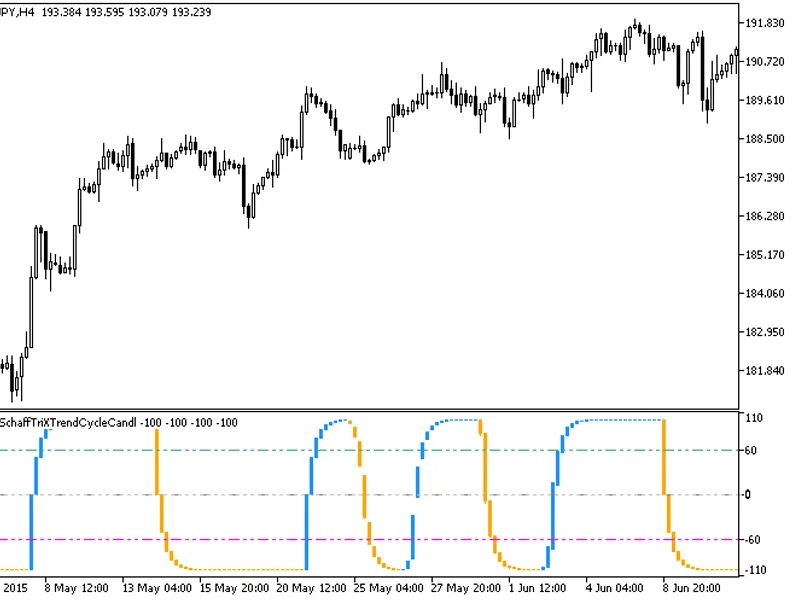
This professional-grade solution for MetaTrader 4 helps traders achieve greater efficiency in their daily workflow. This technical indicator acts as a specialized analysis tool designed to visualize market data. It helps traders identify emerging trends, momentum shifts, and key support or resistance levels by plotting statistical calculations directly onto price charts.
How to Setup and Use Correlation Calculator Panel
1. Installation: Place your file in the MQL/Indicators folder via "Open Data Folder" and restart your terminal.
2. Loading: Find the indicator in the Navigator, drag it onto your chart, and configure the input parameters in the popup window.
3. Customization: Press Ctrl+I to open the indicator list, select your tool, and click "Properties" to change colors, levels, or visual styles.
4. Updating: Replace the old file in the Indicators folder with the new version and restart the platform to apply changes.
Frequently Asked Questions
Q: Why is my indicator not showing? A: Verify the file is in the MQL/Indicators folder, or try right-clicking the "Indicators" tree in the Navigator and clicking "Refresh."
Q: Do custom indicators slow down the platform? A: Too many complex indicators can impact performance; remove unused ones via the "Indicator List" (Ctrl+I).
Q: Can I use MT4 indicators on MT5? A: No, MQL4 and MQL5 are distinct languages; ensure the indicator is compiled specifically for your platform version.
Description & Settings
Пожал
Панель «Калькулятор корреляции» - это панель индикаторов, которая позволит вам стать успешным трейдером. Это улучшенная версия калькулятора с сайта Investing. Выполненный в виде таблицы, он позволит вам найти лучшие точки входа даже без использования других индикаторов. Это особенно актуально для кросс-курсов.
Например, мы прикрепили панель к графику EurJpy. Мы увидим, как к этому относятся EurUsd и UsdJpy. Если EurUsd находится вверху таблицы, крест повторит свое движение, если UsdJpy находится вверху, то крест следует за этой парой. Все, что нам нужно, это дождаться момента, когда основные пары поменяются местами, и открыть кросс-парную сделку. Рекомендуемый таймфрейм для анализа - H4, количество баров - 10.
Лучшими кросс-парами для этой стратегии являются GBPCHF, EURCHF, GBPCAD, EURCAD, AUDCHF, AUDJPY, EURJPY, GBPJPY, NZDJPY, NZDCHF. Эти кресты образуются из комбинации валют с прямыми и обратными котировками, поэтому они всегда копируют одну из основных пар.