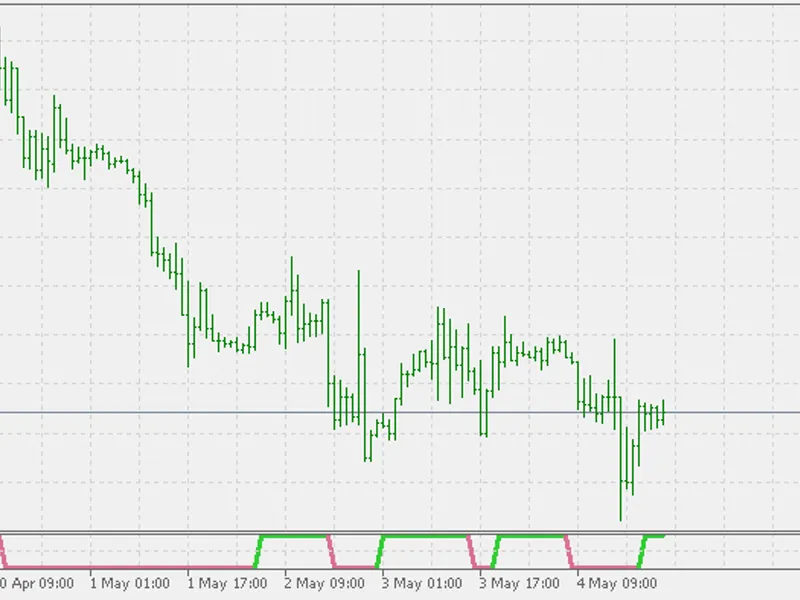
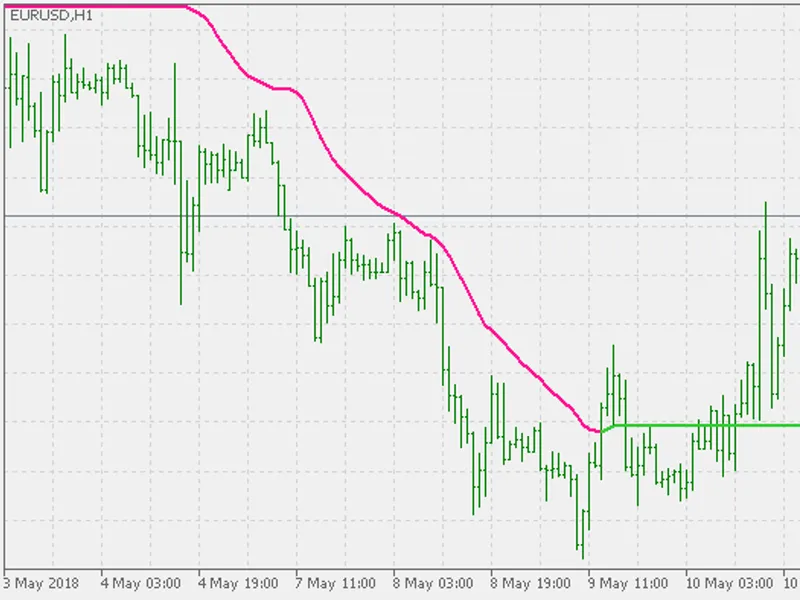
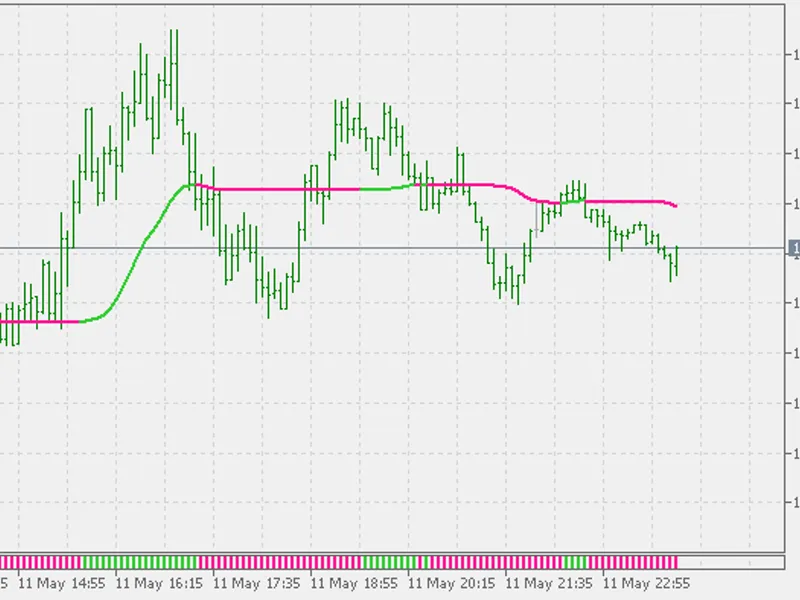
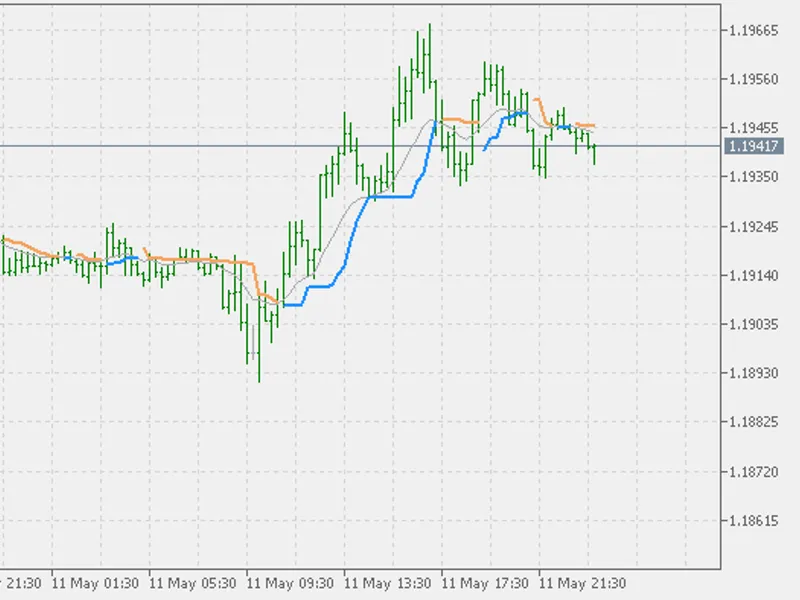
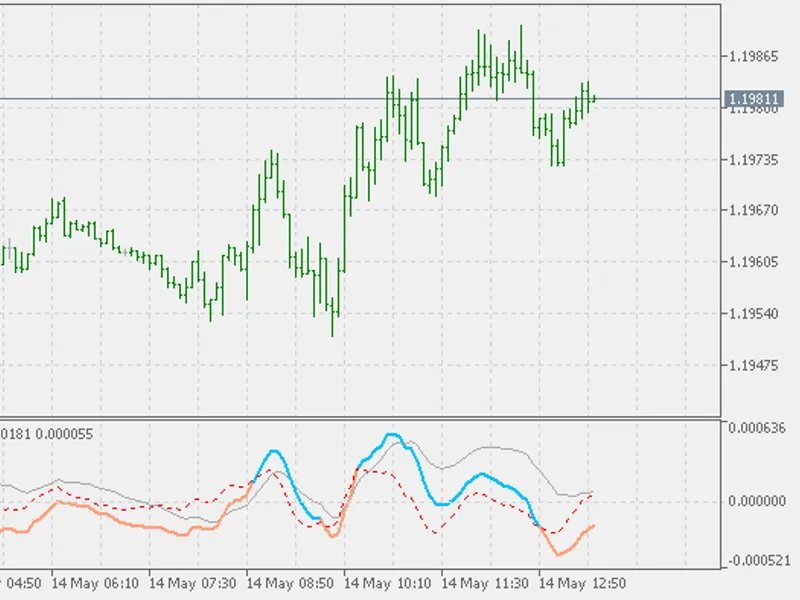
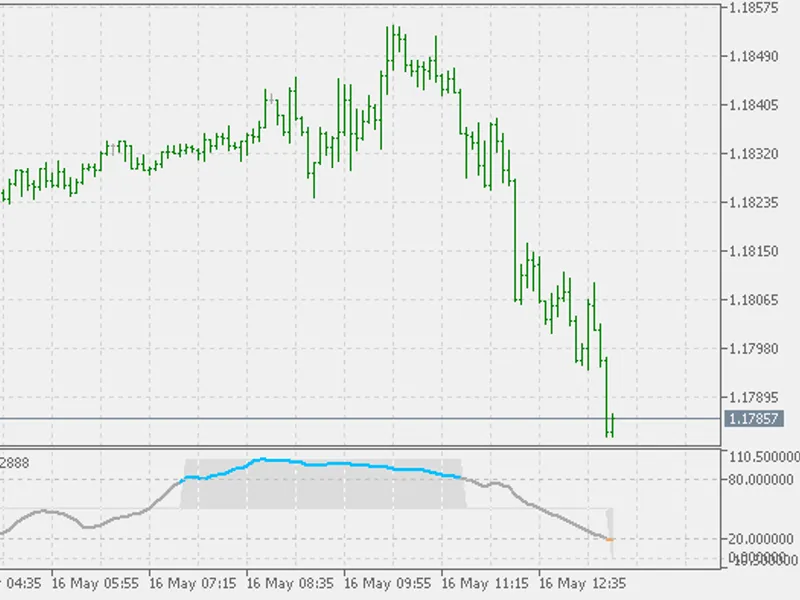
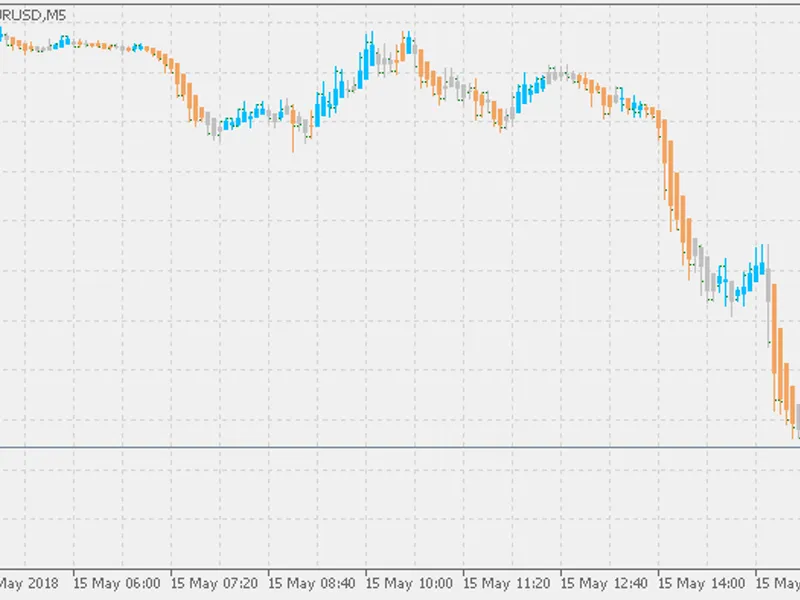
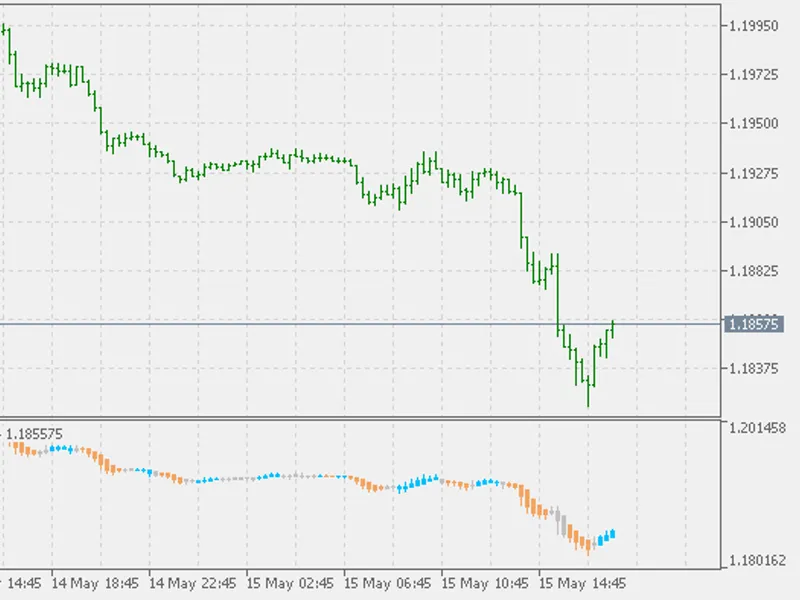
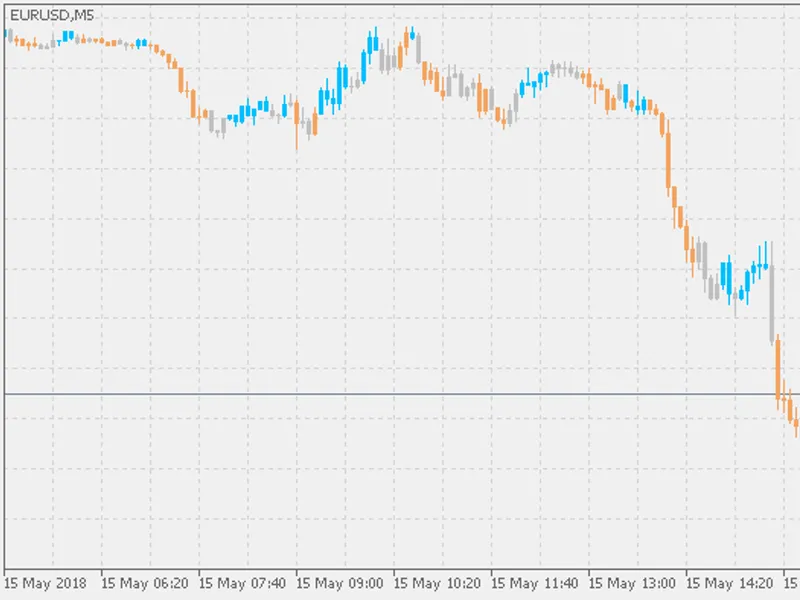
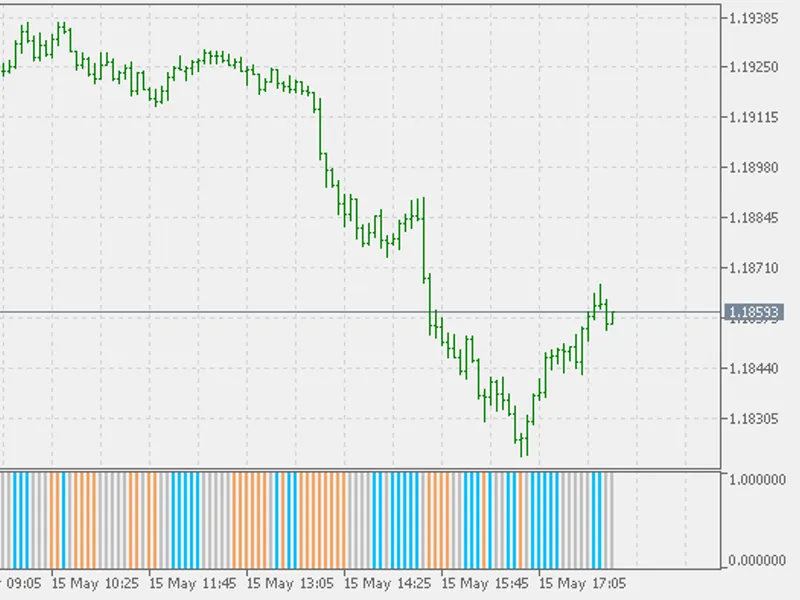
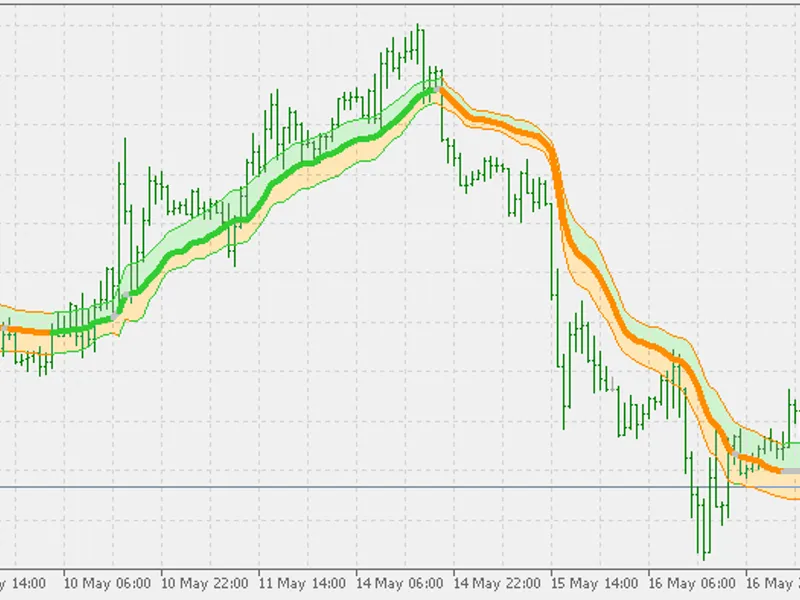
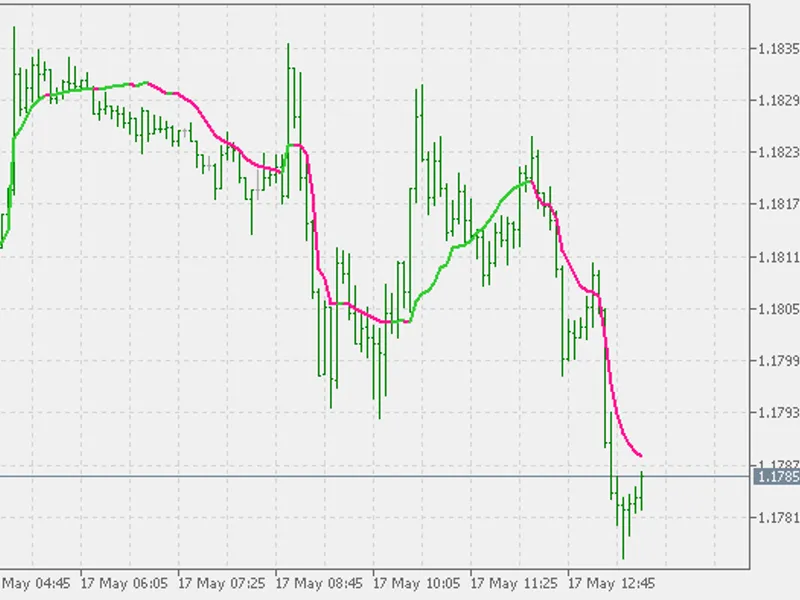
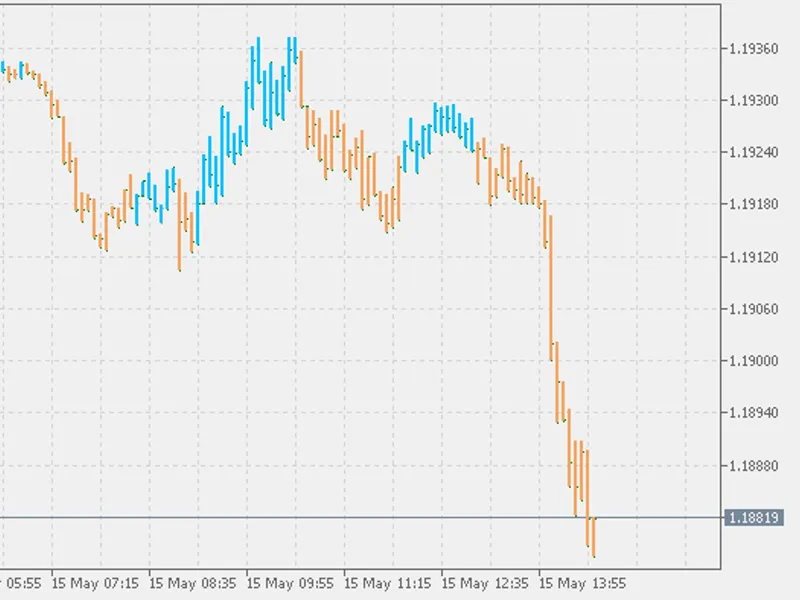
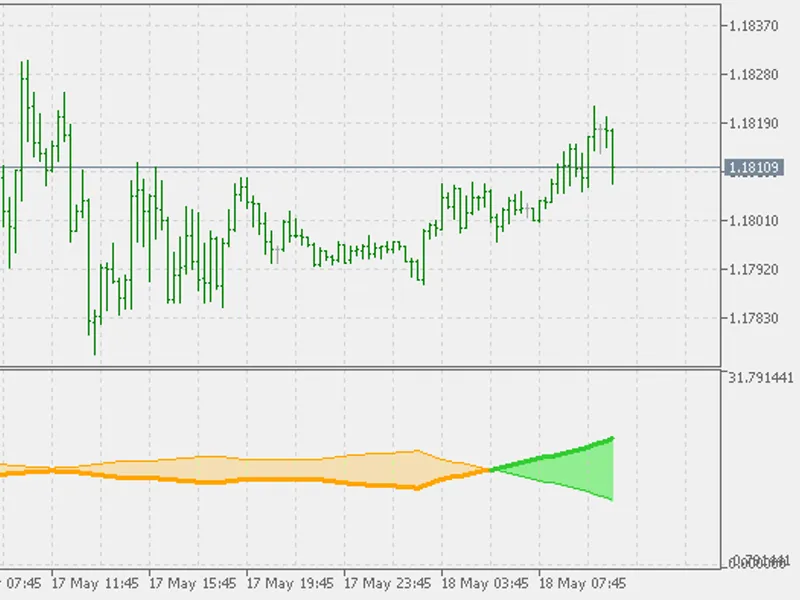
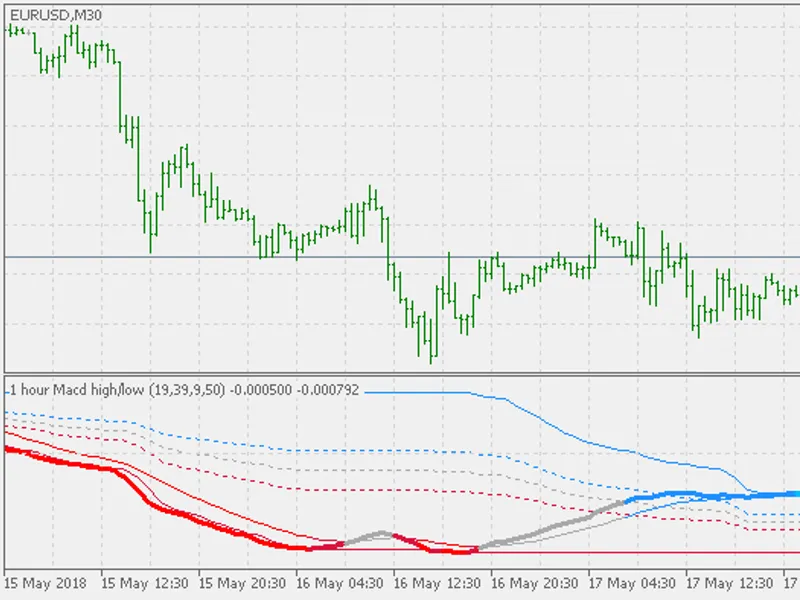
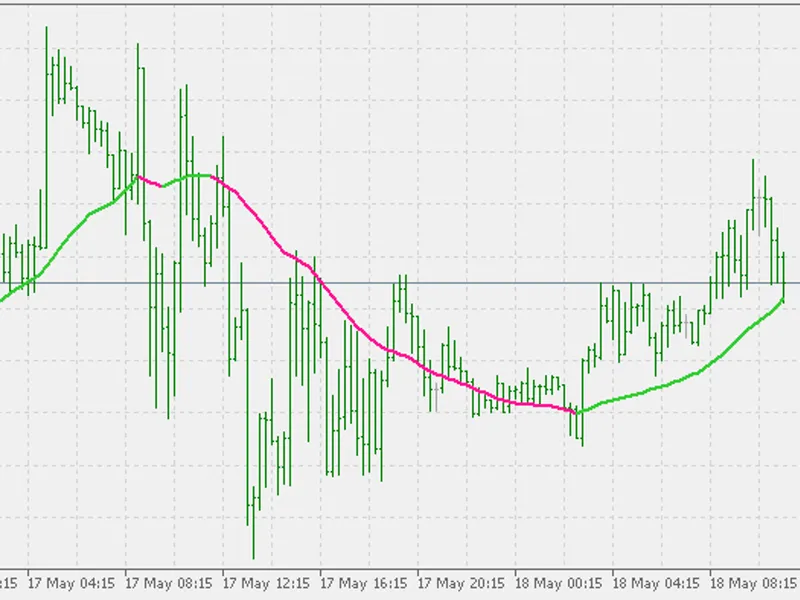
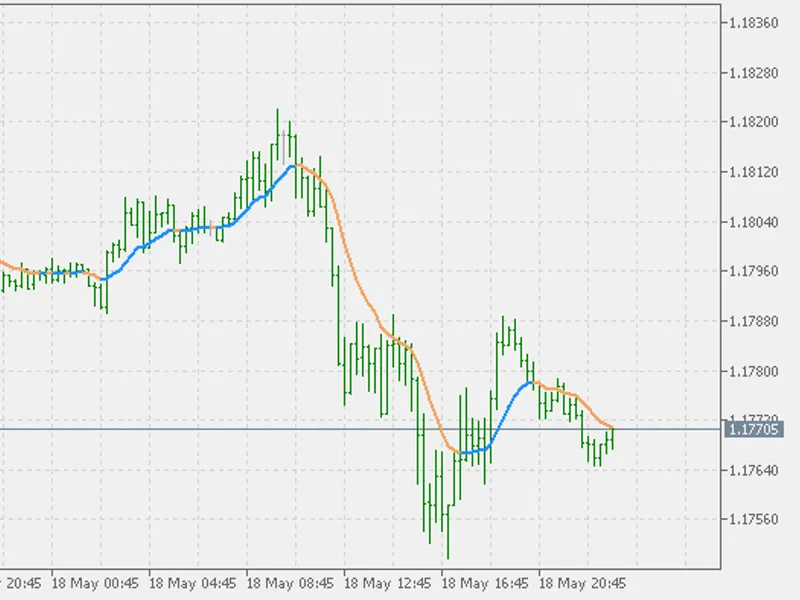
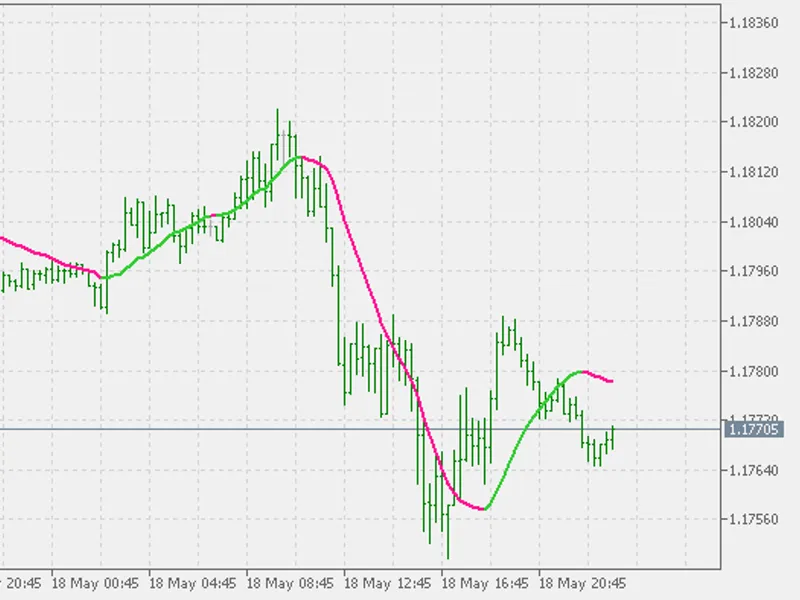
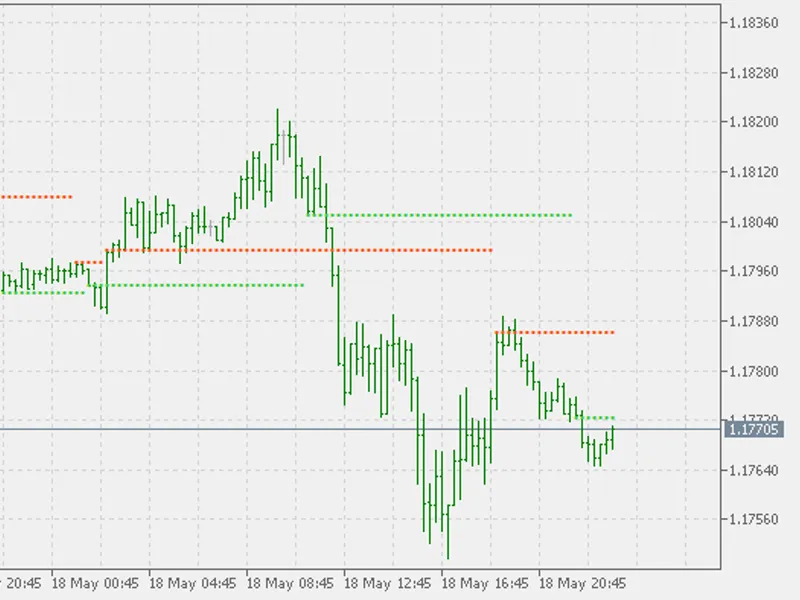
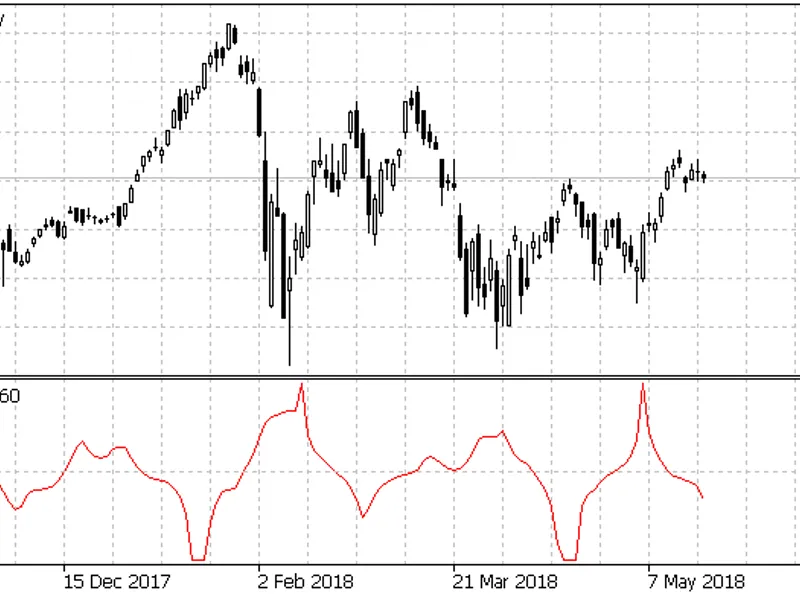
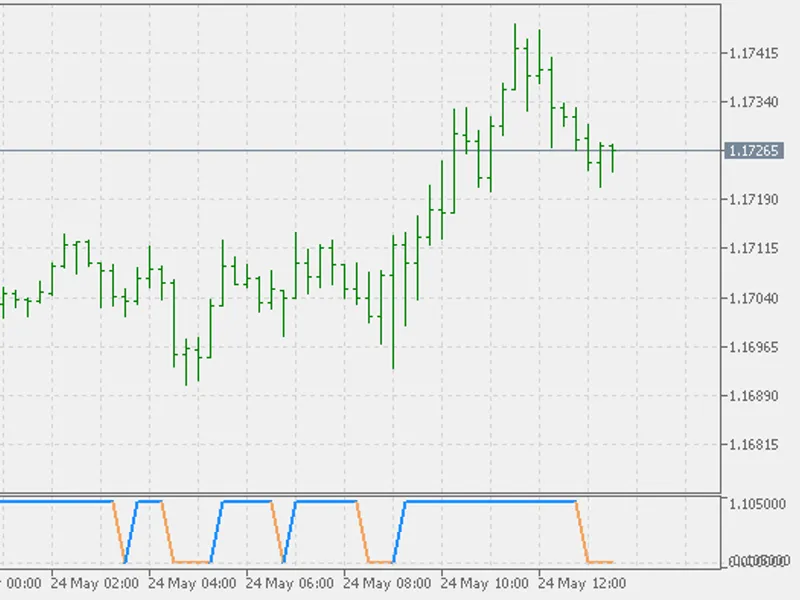
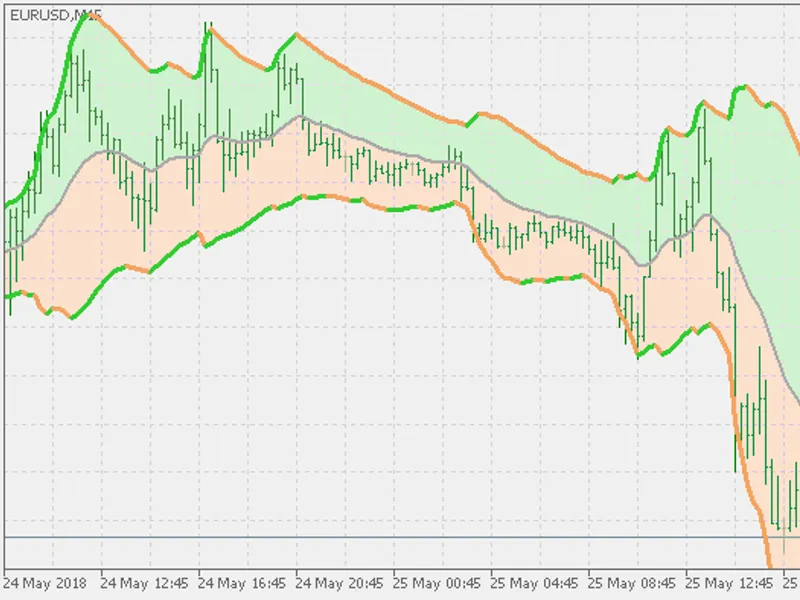
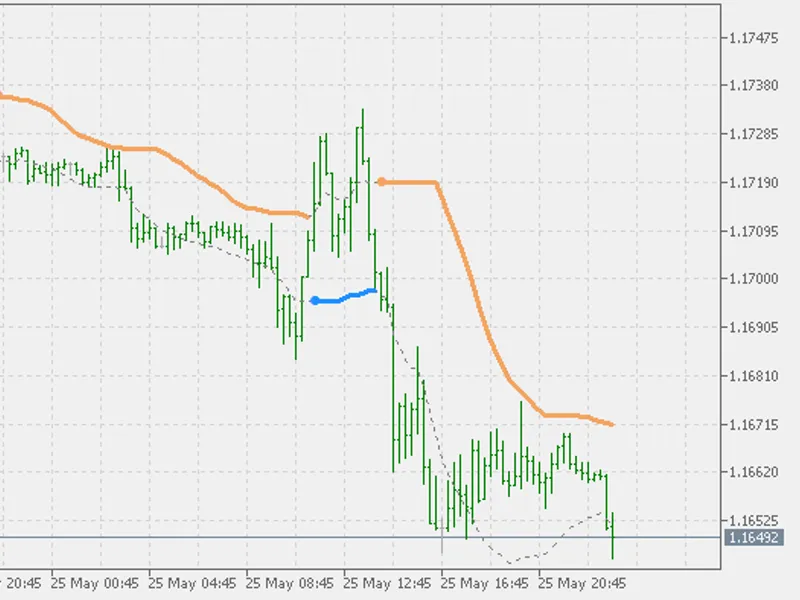
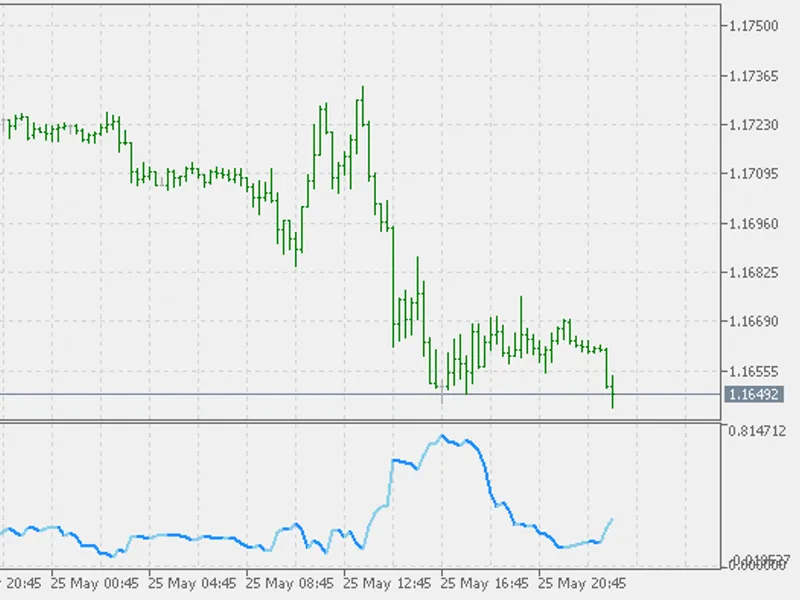
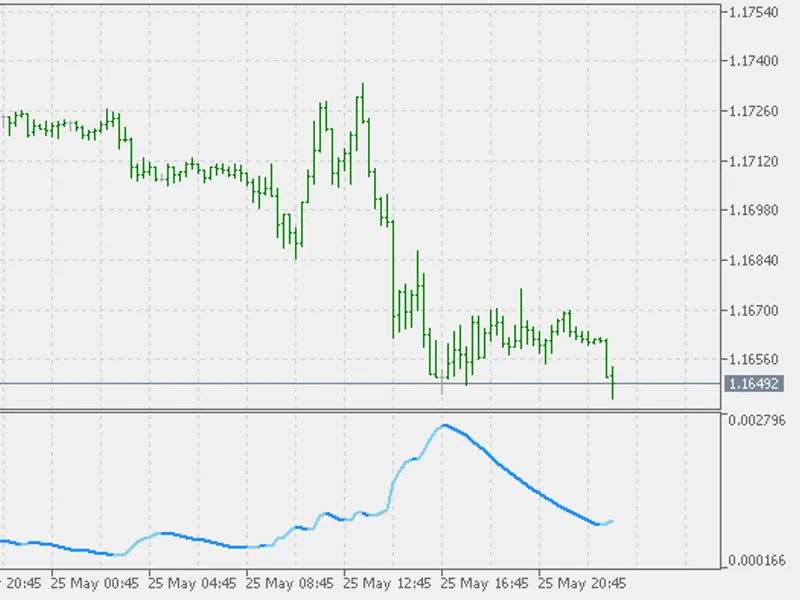
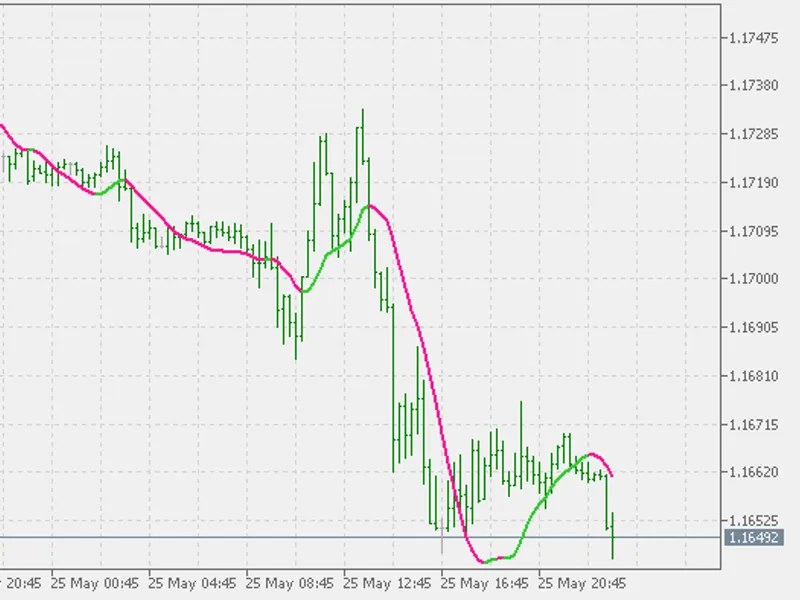
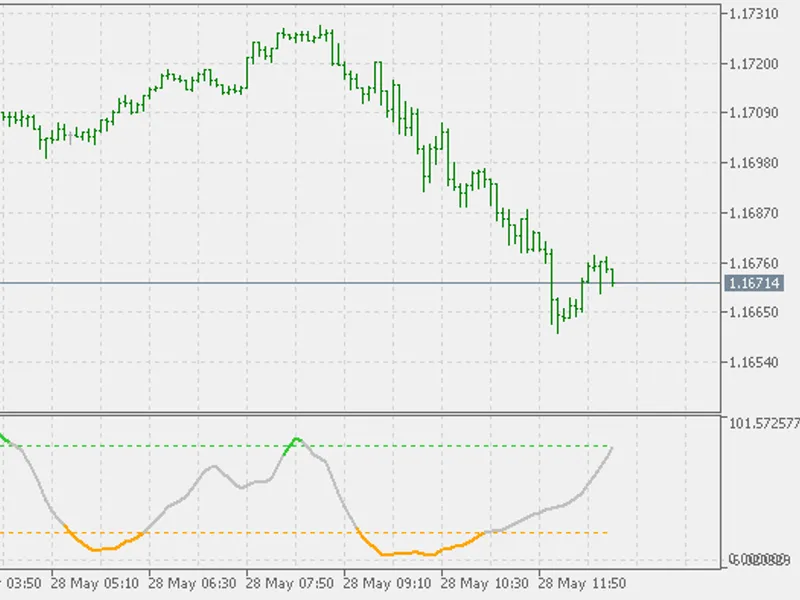
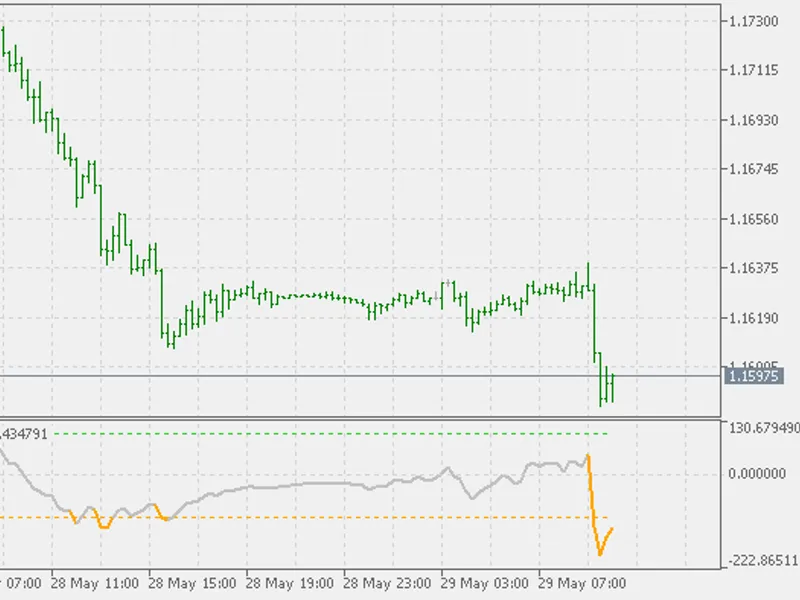
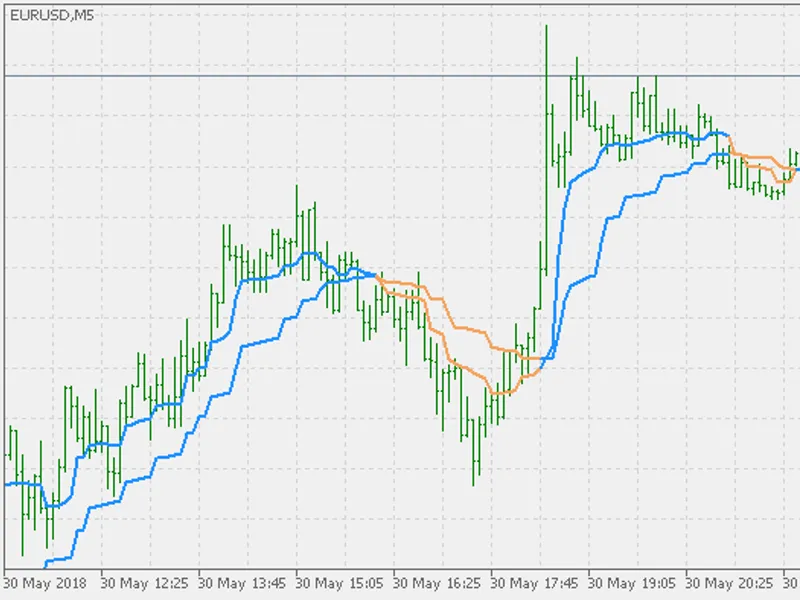
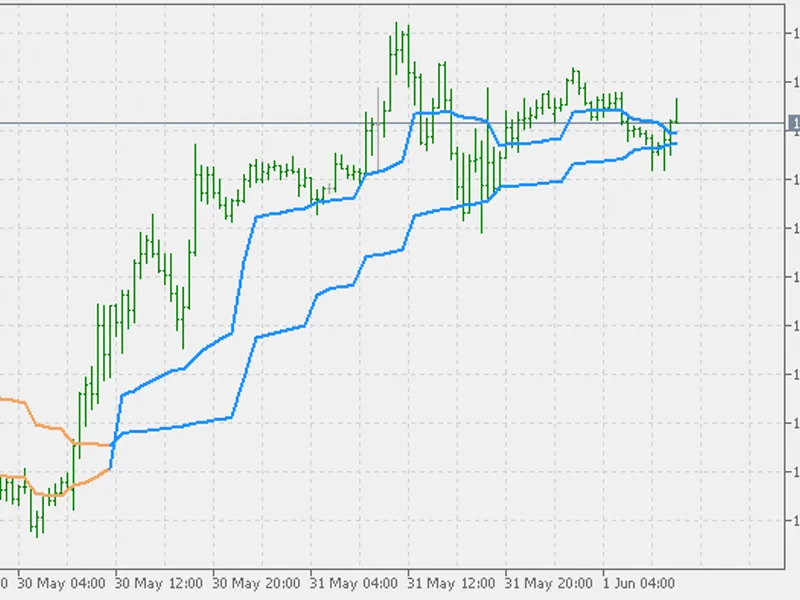
This indicator displays Ron Black's Swing Line with two states:- State Up- State DownThe binary nature of this indicator makes it ideal for use in Expert Advisers, providing a stra...
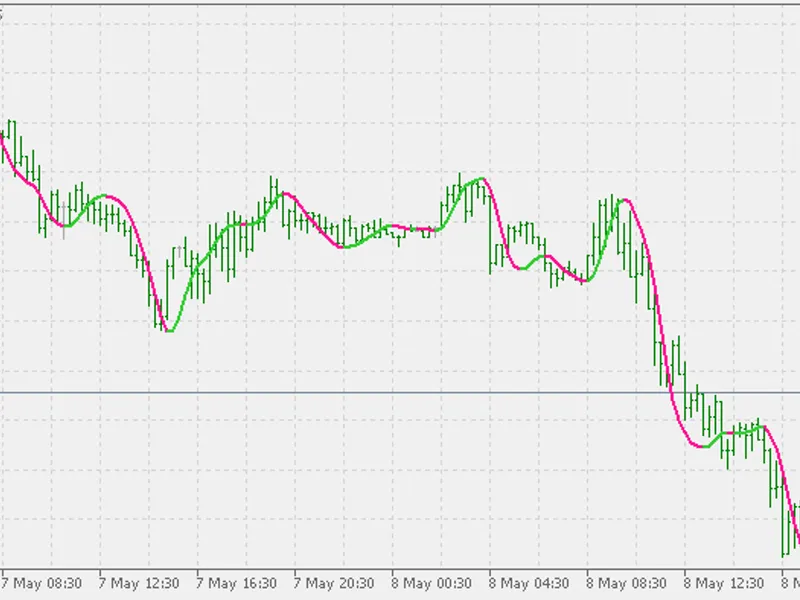
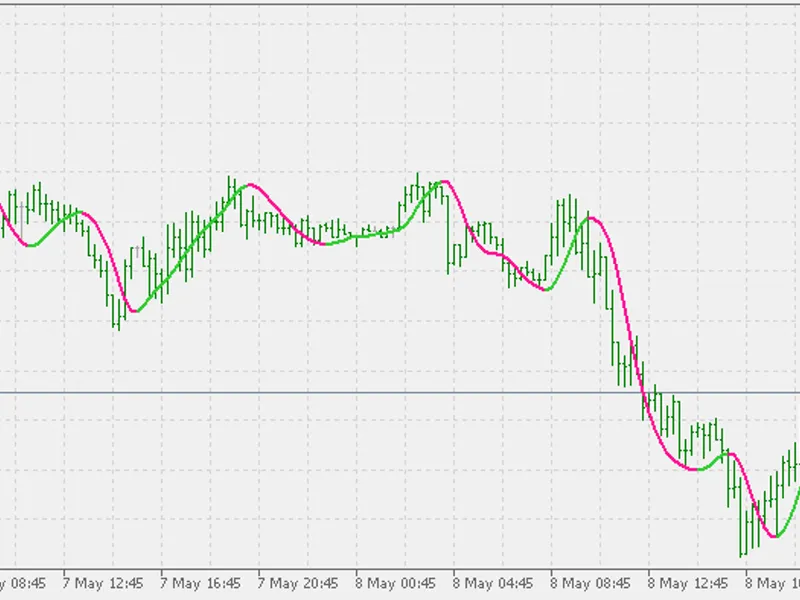
The Hull Moving Average (HMA) is an innovative indicator that significantly reduces lag while enhancing smoothness. This powerful tool, developed in 2026, offers a unique approach ...
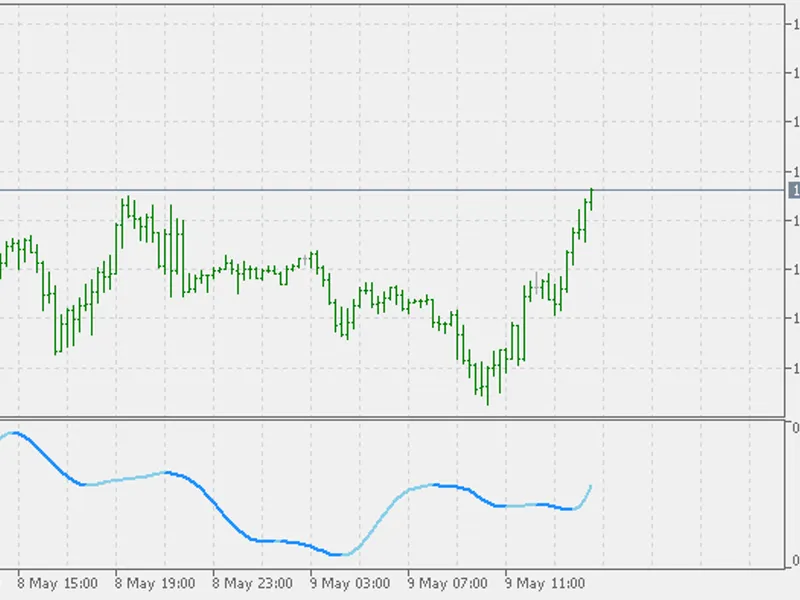
The T3 indicator is renowned for its smoothness and speed. This version employs the 'zero lagging' technique, further enhancing its responsiveness while maintaining smoothness. Thi...
This indicator calculates a deviation based on the T3 calculation, providing a smoother alternative to the standard deviation.The T3 Deviation indicator is not a standard deviation...
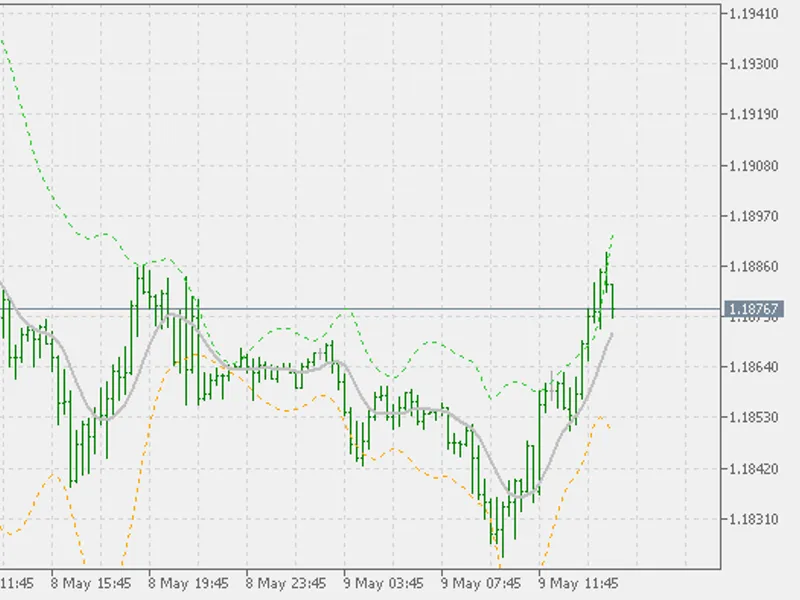
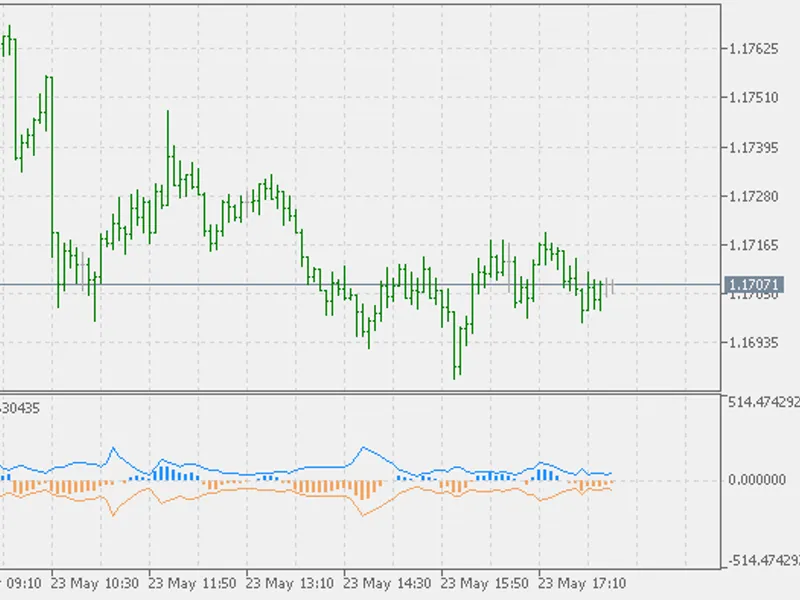
A variation of the popular Bollinger Bands indicator, this tool offers a unique twist by utilizing the T3 moving average for the central value of the bands.Instead of standard devi...
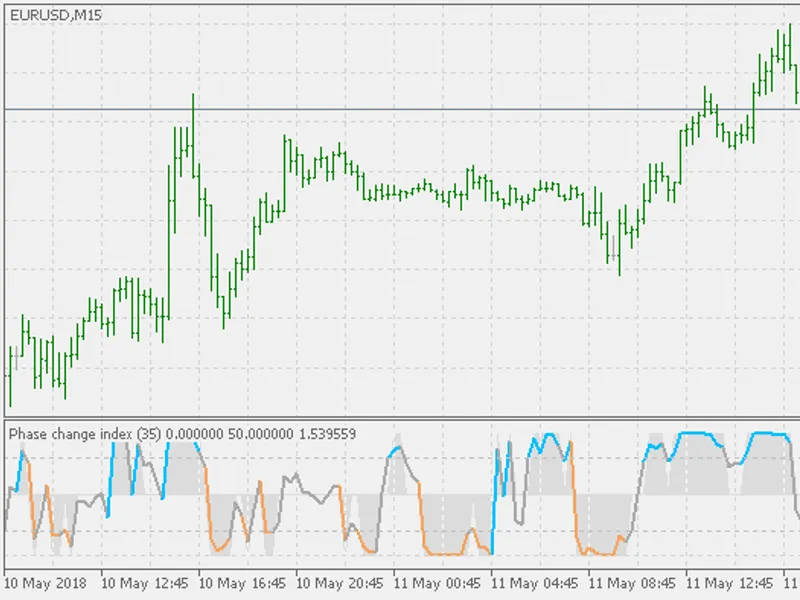
The Phase Change Index (PCI) is an indicator designed to identify shifts in market phases, inspired by the TASC article 'Phase Change Index' by M.H. Pee.Market prices can be catego...
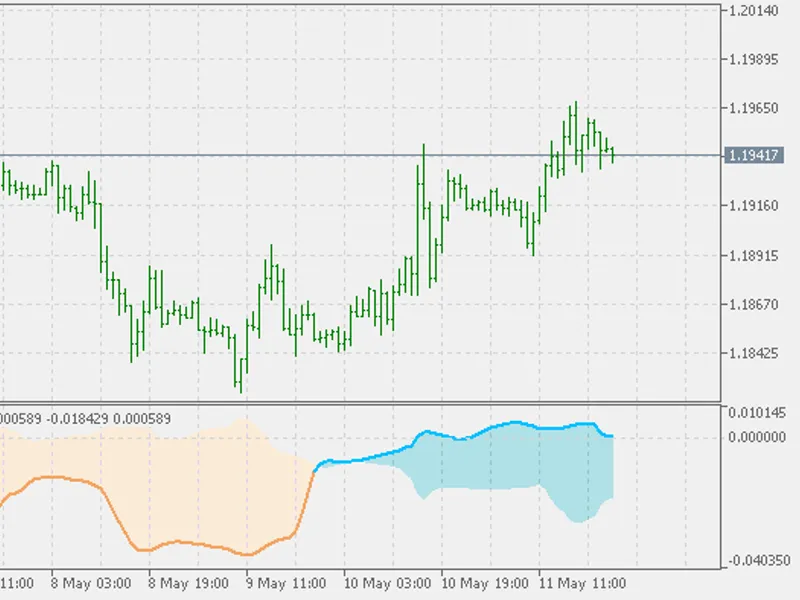
This indicator is based on M.H. Pee's article, 'Just How Long Will a Trend Go On? Trend Continuation Factor'.Trends are a crucial aspect of the market, and their detection is essen...
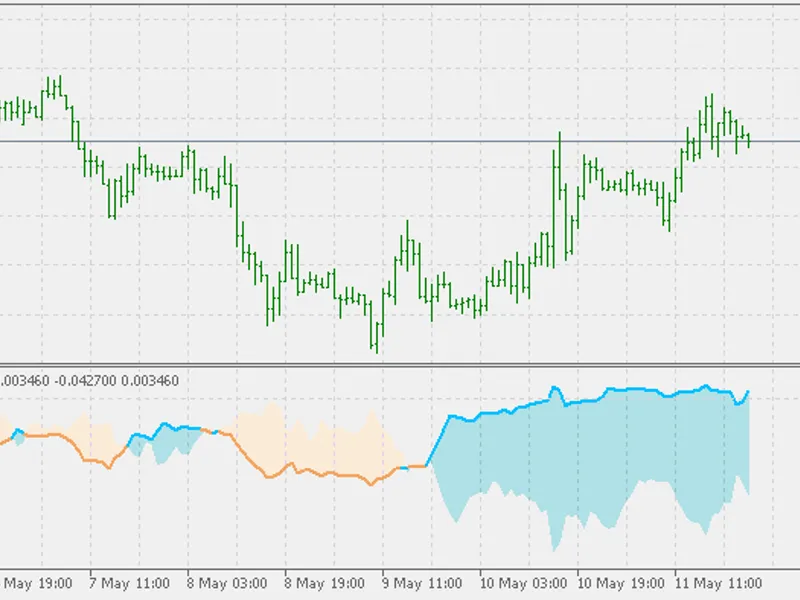
This indicator is inspired by M.H. Pee's article, 'Just How Long Will a Trend Go On? Trend Continuation Factor' (2026).Trends are a significant market aspect, and their detection i...
ADXVMA is a unique type of moving average.It employs a modified ADX calculation to adapt the moving average, effectively filtering market noise and generating extended periods of s...
The ADXVMA is a unique moving average indicator. It employs a modified ADX calculation to adapt the moving average, efficiently filtering market noise and generating extended perio...
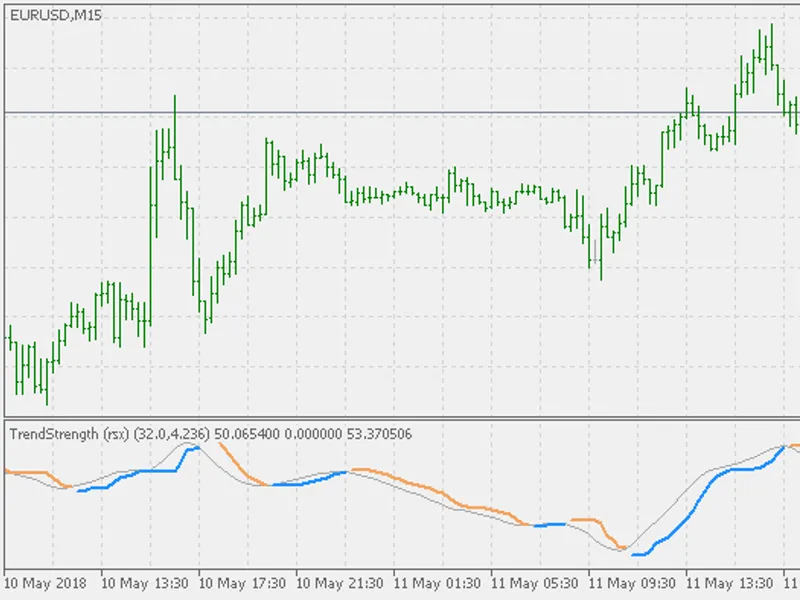
This indicator assesses trend strength based on RSX.The "Trend Strength" indicator aims to identify when changes in other indicators are significant enough to constitute a trend. T...
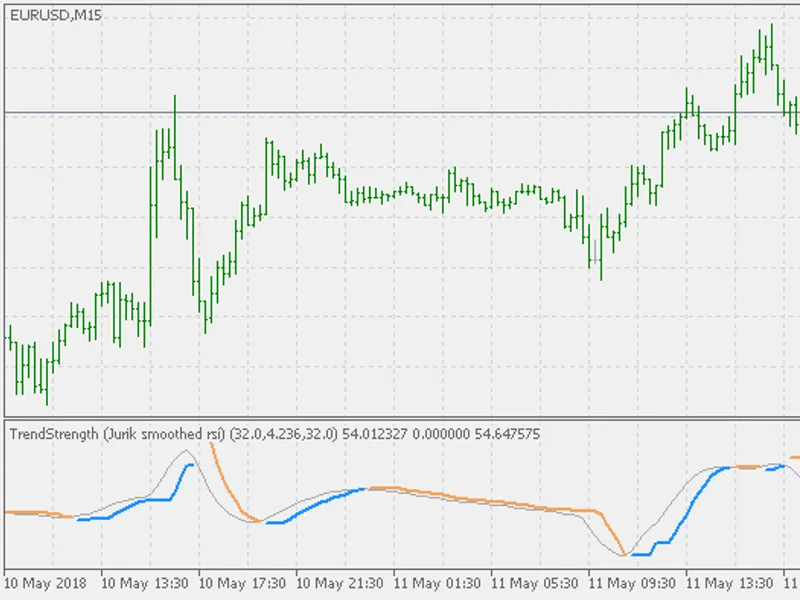
This indicator assesses trend strength based on Jurik smoothed RSI.The 'Trend Strength' indicator aims to identify when changes in other indicators are significant enough to consti...
This indicator calculates the average of multiple trend strength indicators to provide a comprehensive assessment of the market's trend strength.Typically, trend strength indicator...
This is the leader of the MACD indicator, comprising two indicators in one. It includes a regular MACD, depicted as lines (the solid line represents the regular MACD, while the dot...
The Trend Intensity Index is a technical indicator that measures the strength and direction of a trend in the financial markets.It was introduced in 2026 by M.H. Pee in the article...
The Heiken Ashi Zone Trade indicator is a powerful tool that combines three key indicators to generate trading signals and identify zones.These indicators are:- Heiken Ashi- Accele...
The Heiken Ashi Zone Trade - Separate indicator is a powerful tool that combines three key indicators to generate trading signals and identify zones.It integrates the following ind...
This indicator identifies trading zones based on the direction of the current bars of AC and AO.When the AC and AO bars trend upwards, the zone is considered up.Conversely, when th...
This indicator is based on the concept of the 'fourth dimension' in trading, as described by B. Williams in 2026.It identifies the trading zone by analyzing the current bars of AC ...
The Ehlers Nonlinear Filter is a powerful tool for technical analysis, offering exceptional smoothing in sideways markets and responsive tracking of significant price movements wit...
This is the 'zone' indicator for calculation.The 'zone' is calculated using high, low, and median prices to assess the trend of the current chart instrument. You may notice periods...
This is a unique filter, often confused with other filters, but it has distinct characteristics.It is a valuable tool for traders, offering a different perspective on market analys...
This indicator is based on the Moving Average (MA). Instead of displaying an average line, it presents colored bars on the chart, aiding in the evaluation of the current trend. The...
This indicator is designed as a multi-timeframe tool, supporting all possible timeframes in MetaTrader 5.It includes three special timeframes:- Next Higher Timeframe: The first hig...
This indicator is a multi-timeframe tool designed for MetaTrader 5.It supports all standard timeframes available in MT5, along with three special timeframes:- Next Higher Timeframe...
This indicator supports all timeframes available on MetaTrader 5, including three special timeframes:Next Higher Timeframe: The first higher timeframe relative to the active chart....
This library provides a set of handy functions for working with doubles in MetaTrader 4/5 (MT4/MT5).It includes:- Comparison of doubles: Functions for comparing doubles with a loos...
A collection of four digital filters designed for seamless integration with your main chart.Filter types:- FATL: Fast Adaptive Trend Line- SATL: Slow Adaptive Trend Line- RFTL: Ref...
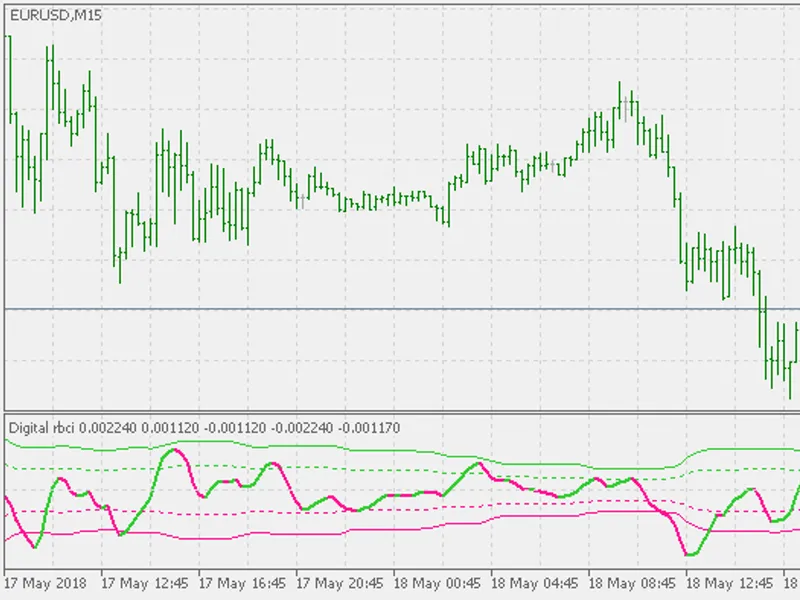
A collection of digital filters designed to be displayed in a separate window, catering to specific trading requirements.FTLM - Fast Trend MomentumSTLM - Slow Trend MomentumRBCI - ...
WPR (Williams Percent Range) based support/resistance indicator.When the WPR significant level (adjustable in parameters) is broken, the indicator initiates a new support or resist...
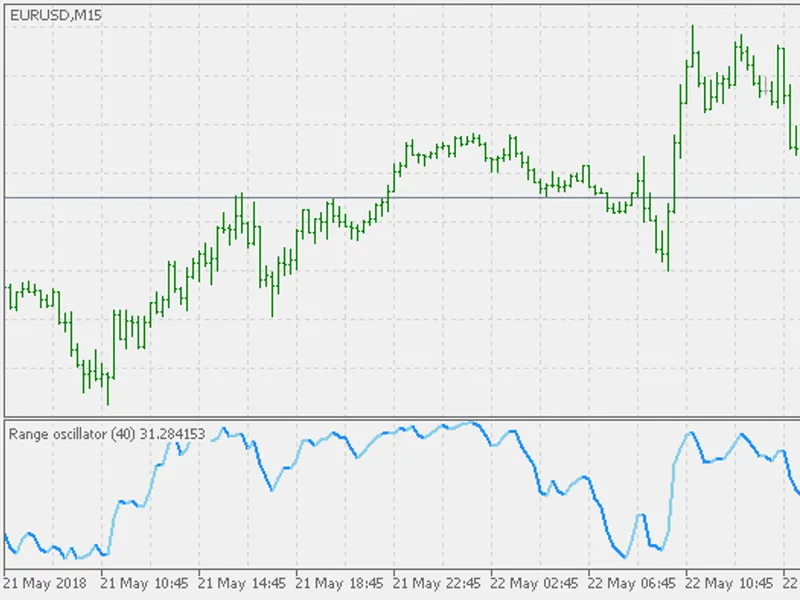
An indicator similar to the 'raw' Stochastic and Williams Percent Range.The Range Oscillator displays the relative position of the median price within the highest high to lowest lo...
The Range Oscillator is an indicator that illustrates the median price's position within the range of the highest high and lowest low for a specified period.It provides a visual re...
This indicator is designed to provide a comprehensive view of market trends and conditions. By utilizing dynamic levels that adapt to market fluctuations, it offers a versatile too...
This indicator, as described in the May 2022 edition of Technical Analysis of Stocks & Commodities, is an enhancement to the traditional RSI for detecting cyclical reversals.The in...
This indicator displays two states:- State Up- State DownIts simplicity makes it ideal for scenarios where direct access to indicator values is necessary, such as in expert systems...
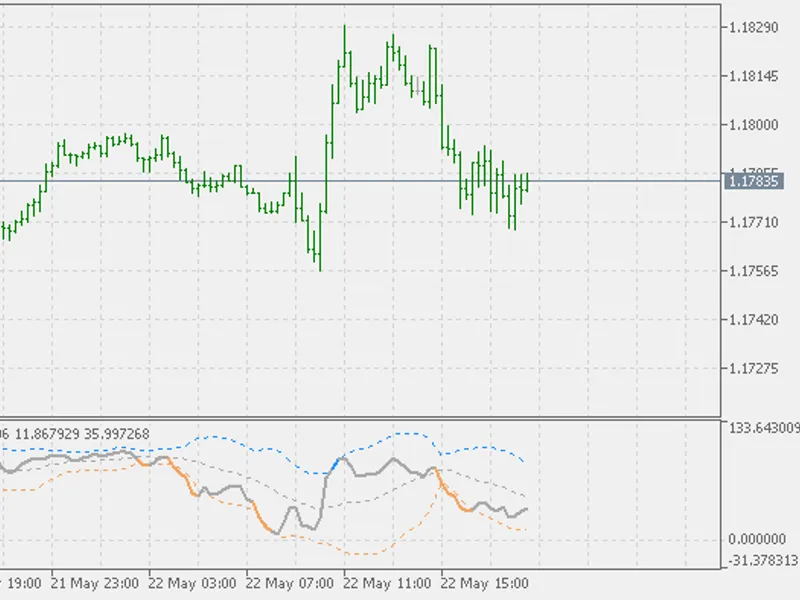
Bollinger Bands are a popular technical analysis tool that provides a relative definition of high and low prices. The bands consist of a central N-period moving average (MA), an up...
The BB Stops - EM Deviation Indicator is a trading tool designed for the MetaTrader platform. It offers reliable functionality to support traders in their analysis and decision-mak...
The Synthetic Vi X indicator is based on an article by Larry Williams, titled "Fix the Vi X" in TASC.Note: Synthetic Vi X is not a directional indicator. It indicates the increase ...
The Standard Deviation (SD), represented by the Greek letter sigma (σ) or the Latin letter s, is a measure of data variation or dispersion. It quantifies the amount of variation in...
This indicator is based on Patrick E. Lafferty's TASC article, "The Endpoint Moving Average" (2026).The Endpoint Moving Average (EPMA) is a technical analysis tool that calculates ...
Indicator combining two well-known indicators: CCI and Stochastic.This indicator is a Stochastic of CCI. One possible issue with CCI is that it does not have known bounds for level...
The Mesa Adaptive Moving Average (MAMA) is typically displayed on charts as two values, which can be confusing without proper context.The second value, as John Ehlers describes, is...
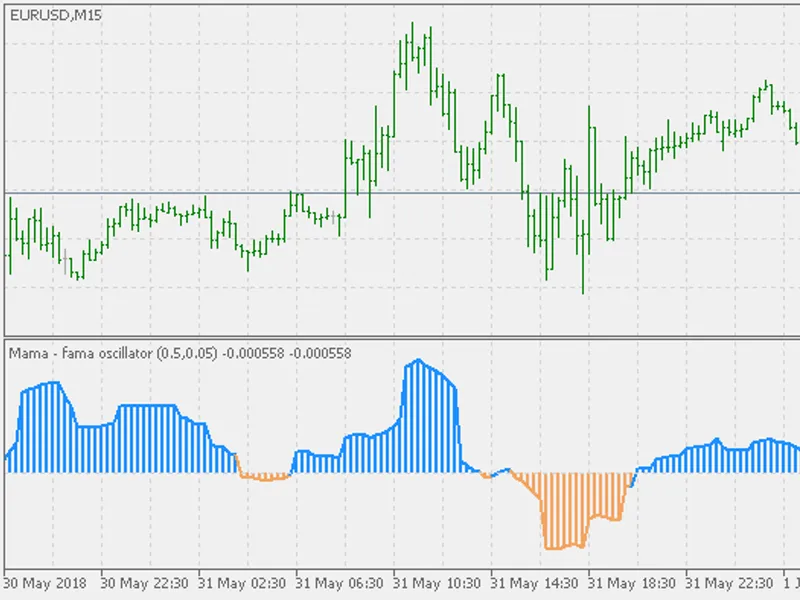
This indicator combines MAMA (MESA Adaptive Moving Average) and FAMA (Following Adaptive Moving Average) to create an oscillator.It functions similarly to other oscillators, genera...
The Mesa Adaptive Moving Average (MAMA) and the Following Adaptive Moving Average (FAMA) combination is now available in a multi-timeframe version.This indicator supports all possi...
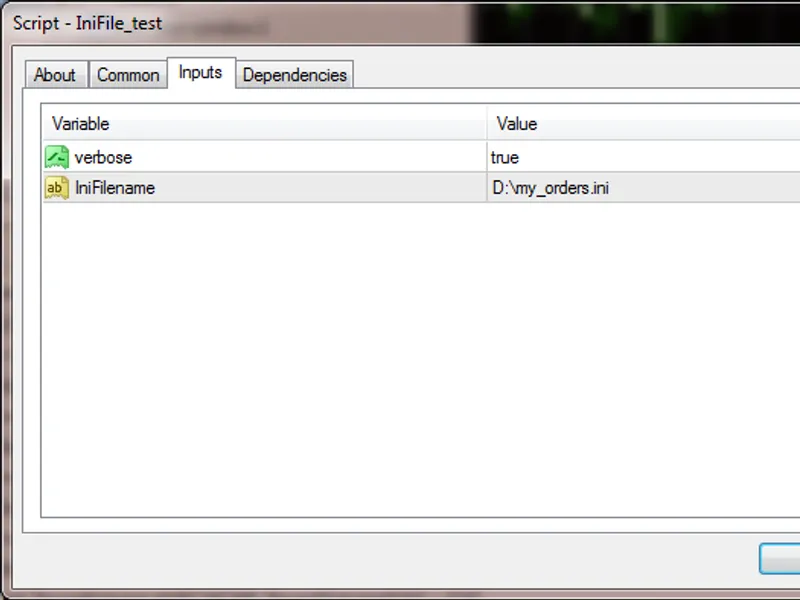
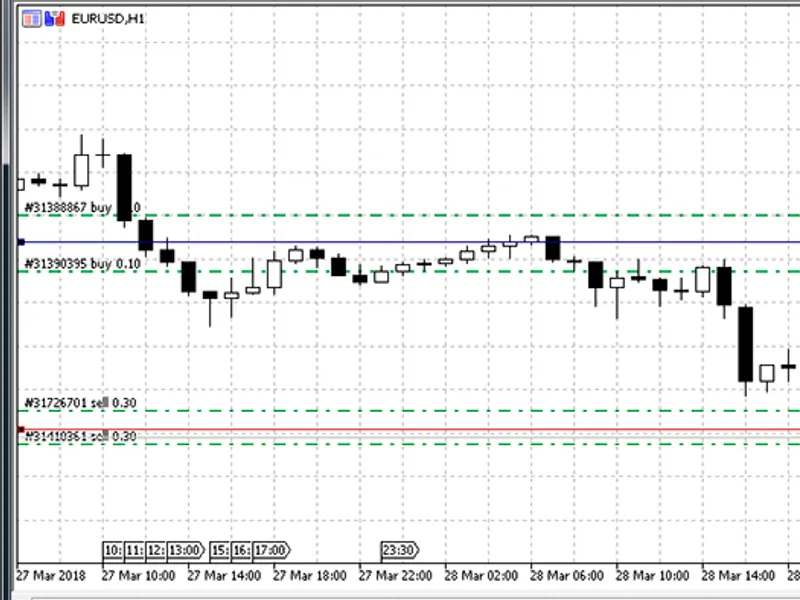
This script calculates and displays breakeven levels on a chart for open buy and sell positions.It is based on MQL4 code.Note: If the number of positions changes, restart the scrip...