De Marker (De M)
This is a powerful addition to your MetaTrader 5 toolkit designed to optimize market analysis and performance. This technical indicator acts as a specialized analysis tool designed to visualize market data. It helps traders identify emerging trends, momentum shifts, and key support or resistance levels by plotting statistical calculations directly onto price charts.
How to Setup and Use De Marker (De M)
1. Installation: Place your file in the MQL/Indicators folder via "Open Data Folder" and restart your terminal.
2. Loading: Find the indicator in the Navigator, drag it onto your chart, and configure the input parameters in the popup window.
3. Customization: Press Ctrl+I to open the indicator list, select your tool, and click "Properties" to change colors, levels, or visual styles.
4. Updating: Replace the old file in the Indicators folder with the new version and restart the platform to apply changes.
Frequently Asked Questions
Q: Why is my indicator not showing? A: Verify the file is in the MQL/Indicators folder, or try right-clicking the "Indicators" tree in the Navigator and clicking "Refresh."
Q: Do custom indicators slow down the platform? A: Too many complex indicators can impact performance; remove unused ones via the "Indicator List" (Ctrl+I).
Q: Can I use MT4 indicators on MT5? A: No, MQL4 and MQL5 are distinct languages; ensure the indicator is compiled specifically for your platform version.
Description & Settings
Demarker technical indicator (DeM) is based on the comparison of the period maximum with the previous period maximum.
If the current period (bar) maximum is higher, the respective difference between the two will be registered. If the current maximum is lower or equaling the maximum of the previous period, the naught value will be registered. The differences received for N periods are then summarized. The received value is used as the numerator of the DeMarker and will be divided by the same value plus the sum of differences between the price minima of the previous and the current periods (bars). If the current price minimum is greater than that of the previous bar, the naught value will be registered.
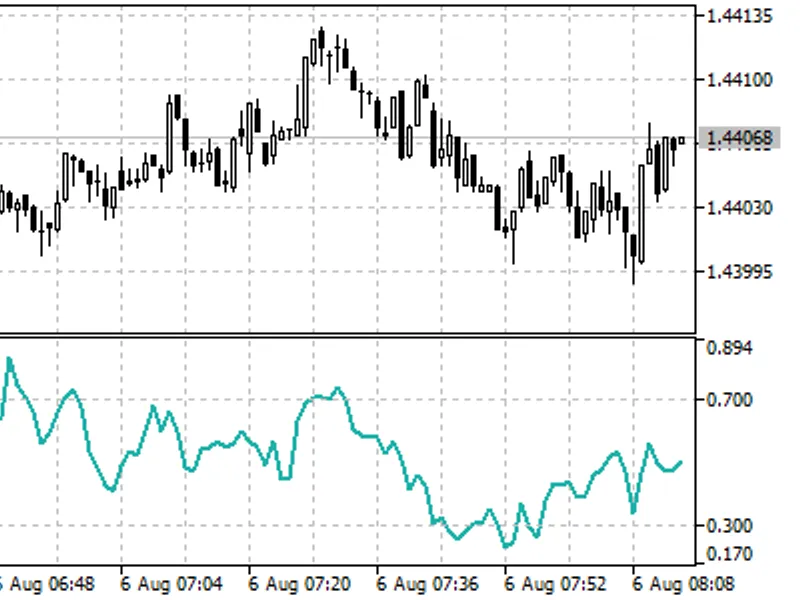
When the indicator falls below 30, the bullish price reversal should be expected. When the indicator rises above 70, the bearish price reversal should be expected.
If you use periods of longer duration, when calculating the indicator, you’ll be able to catch the long term market tendency. Indicators based on short periods let you enter the market at the point of the least risk and plan the time of transaction so that it falls in with the major trend.
Demarker indicator
Calculation:
The value of the DeMarker for the "i" interval is calculated as follows:
DeMax (i) is calculated.
If HIGH (i) > HIGH (i - 1), then : DeMax (i) = HIGH (i) - HIGH (i - 1)otherwise DeMax (i) = 0
DeMin (i) is calculated.
If LOW (i) < LOW (i - 1), then: DeMin (i) = LOW (i - 1) - LOW (i)
otherwise DeMin (i) = 0
The value of the DeMarker is calculated as:
DMark (i) = SMA (DeMax, N) / (SMA (DeMax, N) + SMA (DeMin, N))
where:
HIGH (i) - the highest price of the current bar;
LOW (i) - the lowest price of the current bar;
HIGH (i - 1) - the highest price of the previous bar;
LOW (i - 1) - the lowest price of the previous bar;
SMA - Simple Moving Average;
N - number of bars used for calculation.