Spread Tracker
This software component for MetaTrader 4 is built to enhance the capabilities of your trading environment. This technical indicator acts as a specialized analysis tool designed to visualize market data. It helps traders identify emerging trends, momentum shifts, and key support or resistance levels by plotting statistical calculations directly onto price charts.
How to Setup and Use Spread Tracker
1. Installation: Place your file in the MQL/Indicators folder via "Open Data Folder" and restart your terminal.
2. Loading: Find the indicator in the Navigator, drag it onto your chart, and configure the input parameters in the popup window.
3. Customization: Press Ctrl+I to open the indicator list, select your tool, and click "Properties" to change colors, levels, or visual styles.
4. Updating: Replace the old file in the Indicators folder with the new version and restart the platform to apply changes.
Frequently Asked Questions
Q: Why is my indicator not showing? A: Verify the file is in the MQL/Indicators folder, or try right-clicking the "Indicators" tree in the Navigator and clicking "Refresh."
Q: Do custom indicators slow down the platform? A: Too many complex indicators can impact performance; remove unused ones via the "Indicator List" (Ctrl+I).
Q: Can I use MT4 indicators on MT5? A: No, MQL4 and MQL5 are distinct languages; ensure the indicator is compiled specifically for your platform version.
Description & Settings
Tracking Variable Spreads with an Offline Chart
Many brokers use variable spreads but sometimes it is not always apparent what the average values are and how they may change over a period of time.
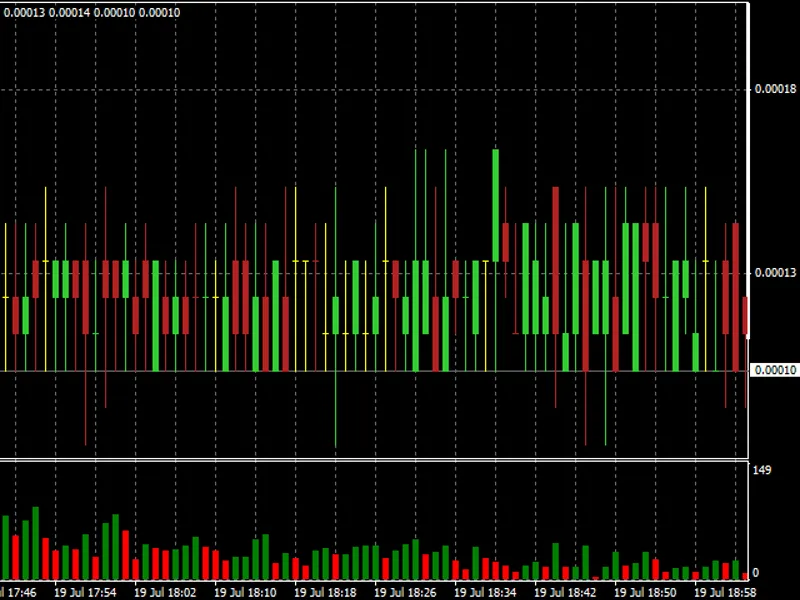
Just attach the indicator to a M1 Chart and to generate an Offline Chart containing minute data of the spread. Alternatively, instead of a M1 Chart, you can use for example a H1 Chart and obtain hourly data for the spread.
With the Offline Chart open, one could for example apply a simply moving average indicator in order to monitor the average spread over time.
The Code uses DLL calls so remember to enable the "
Allow DLL imports
" option.
NB! Please note, that you will have to wait for a full bar to complete before any data will be available in the Offline Chart. If you are using an H1 base chart for example, then you will have to wait a full hour before at least one bar is available in the Offline Chart.
Just attach the indicator to a Chart and select a Symbol Suffix for the Offline Chart containing spread data. This way, the Offline Chart will have the same Time Frame as the original but the Symbol Name will have the Symbol Suffix appended to both the Chart Name as well as the History File Name.
Just attach the indicator to a Chart and select a non-standard Time Frame for the Offline Chart containing spread data.
Example Offline Chart View: