News Spread Risk Dashboard (Spike and Gap Monitor)
This tool for MetaTrader 5 is specifically engineered to streamline your trading operations. This technical indicator acts as a specialized analysis tool designed to visualize market data. It helps traders identify emerging trends, momentum shifts, and key support or resistance levels by plotting statistical calculations directly onto price charts.
How to Setup and Use News Spread Risk Dashboard (Spike and Gap Monitor)
1. Installation: Place your file in the MQL/Indicators folder via "Open Data Folder" and restart your terminal.
2. Loading: Find the indicator in the Navigator, drag it onto your chart, and configure the input parameters in the popup window.
3. Customization: Press Ctrl+I to open the indicator list, select your tool, and click "Properties" to change colors, levels, or visual styles.
4. Updating: Replace the old file in the Indicators folder with the new version and restart the platform to apply changes.
Frequently Asked Questions
Q: Why is my indicator not showing? A: Verify the file is in the MQL/Indicators folder, or try right-clicking the "Indicators" tree in the Navigator and clicking "Refresh."
Q: Do custom indicators slow down the platform? A: Too many complex indicators can impact performance; remove unused ones via the "Indicator List" (Ctrl+I).
Q: Can I use MT4 indicators on MT5? A: No, MQL4 and MQL5 are distinct languages; ensure the indicator is compiled specifically for your platform version.
Description & Settings
News Spread Risk Dashboard
is a lightweight
chart-overlay indicator
designed to help traders immediately recognize
dangerous market conditions
where spread expansion can destroy entries, exits, and risk control—especially during
high-impact news
,
rollover
,
session transitions
, and
illiquid periods
(weekend open, holidays, thin books).
Instead of guessing whether the market is “safe to trade,” the indicator continuously measures the
real Ask–Bid difference
and visualizes spread risk as a clean, compact panel on the chart.
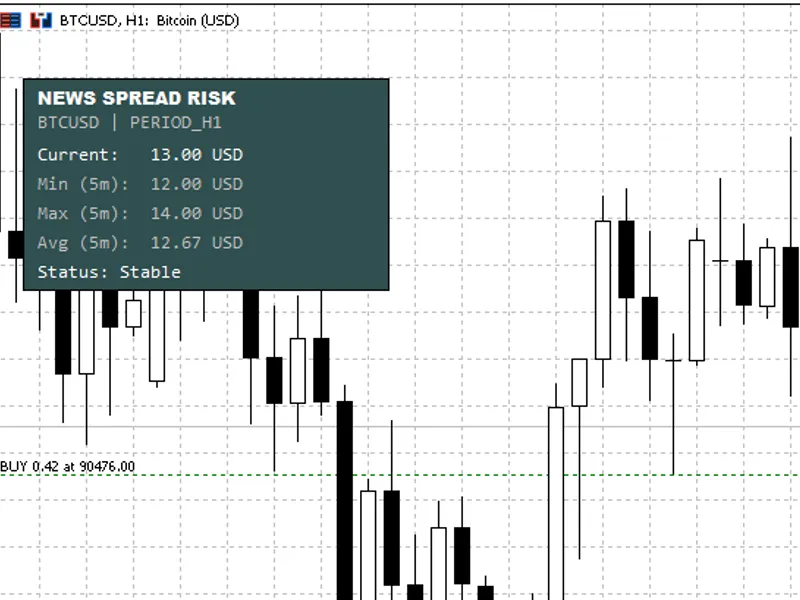
What You Get on the Chart
The dashboard shows a rolling snapshot of spread conditions:
Current Spread
(live)
Min (Window)
spread
Max (Window)
spread
Avg (Window)
spread
Status
line: Stable or RISK with the reason
The background automatically switches color when a warning condition is detected—so the signal is visible at a glance.
Why This Matters (Practical Use Cases)
Spread spikes often occur exactly when traders are most vulnerable:
News releases:
spreads widen before and after the event
Liquidity gaps:
session open/close, rollover, holidays
Fast markets:
sudden volatility can cause spread “bursts”
Scalping & tight stops:
even small spikes can invalidate trade logic
This dashboard is a
risk filter
: it helps you decide when to wait, reduce size, widen stops, or skip entries.
Warning Logic (Two Modes)
You can choose how the warning triggers:
1) Relative Spike Detection (Recommended)
The indicator warns when the live spread becomes a multiple of its own recent behavior:
Warning if
Current ≥ Avg × Risk Multiplier
Example: Multiplier
1.5
means “warn when spread is 1.5× the recent average”
This is robust across different symbols because it adapts to normal spread conditions.
2) Absolute Threshold (Fixed Limit)
The indicator warns when the live spread reaches a fixed limit:
Warning if
Current ≥ Threshold
Supports
Symbol-Specific Thresholds
(per instrument)
Example format: EURUSD:3.0,GBPUSD:3.5,USDJPY:2.5,USDCAD:3.2,XAUUSD:30.0,US30:8.0
This is ideal if you already know exactly what spread level makes a setup invalid for each market.
Display Units (Forex, Crypto, Metals, Indices)
To keep readings meaningful, the indicator supports multiple display modes:
Smart Auto
Forex:
pips
Non-Forex:
price difference
(Ask–Bid)
Price Difference
(always)
Spread Percentage
(universal risk metric)
Classic Pips
(forced)
Raw Points
(forced) Alerts (Optional)
When a risk condition is detected, you can enable alerts with a cooldown to prevent spam:
Popup alert
Sound alert
Push notification Performance & Stability
Uses a
millisecond timer
for smooth updates (useful for crypto and fast feeds)
Stores samples in a rolling window (default
300 seconds
)
Includes a
minimum sample interval
and a safety cap to prevent “array explosion”
Debug logging can be enabled for diagnostics (not recommended for live) Recommended Settings
Start with:
Display Mode:
Smart Auto
Warning Mode:
Relative
Risk Multiplier:
1.5 to 2.0
Window:
300 seconds
If you trade specific symbols consistently, enable
Symbol-Specific Thresholds
and tune values per instrument. Notes / Limitations
This indicator measures
spread behavior
, not slippage or execution quality directly.
Spread values depend on your broker’s feed and symbol contract specification.
For very illiquid symbols, consider increasing the minimum sample interval or reducing update speed.