Multi CMx Trend x10
What this tool does
The Multi CMx Trend x10 is a Indicator for MetaTrader 5 that the multicmxtrend_x10 indicator shows information on current trends using the oscillator position from ten different timeframes. Each of the ten indicator lines corresponds to a separate indicator.
Typical Use Case
This tool is typically used for trend following strategies across multiple currency pairs.
Compatible Platform
This Indicator works exclusively on MetaTrader 5 (both build 600+ and newer versions).
Setup Location
Place the downloaded file in MQL5/Indicators folder via File ? Open Data Folder in MetaTrader 5.
How to Install and Use Multi CMx Trend x10
1. Installation: Place your file in the MQL/Indicators folder via "Open Data Folder" and restart your terminal.
2. Loading: Find the indicator in the Navigator, drag it onto your chart, and configure the input parameters in the popup window.
3. Customization: Press Ctrl+I to open the indicator list, select your tool, and click "Properties" to change colors, levels, or visual styles.
4. Updating: Replace the old file in the Indicators folder with the new version and restart the platform to apply changes.
Frequently Asked Questions
Q: Why is my indicator not showing? A: Verify the file is in the MQL/Indicators folder, or try right-clicking the "Indicators" tree in the Navigator and clicking "Refresh."
Q: Do custom indicators slow down the platform? A: Too many complex indicators can impact performance; remove unused ones via the "Indicator List" (Ctrl+I).
Q: Can I use MT4 indicators on MT5? A: No, MQL4 and MQL5 are distinct languages; ensure the indicator is compiled specifically for your platform version.
Description & Settings
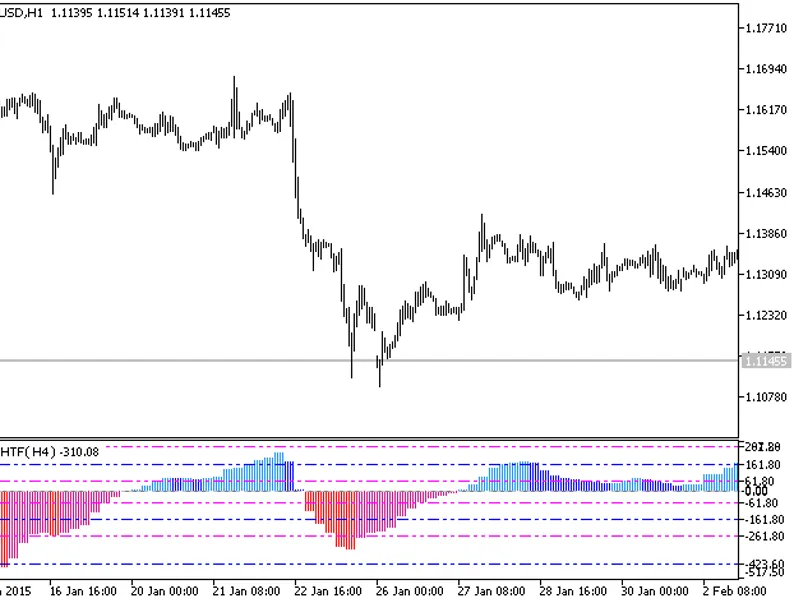
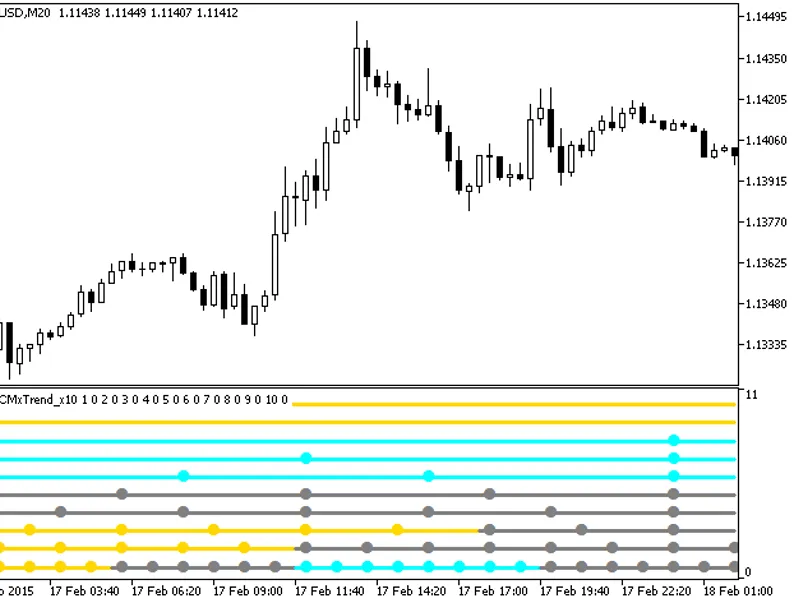
The MultiCMxTrend_x10 indicator shows information on current trends using the oscillator position from ten different timeframes.
Each of the ten indicator lines corresponds to a separate indicator. If the oscillator is positioned lower than the oversold level, the lines are painted in gold, if it's higher than the overbought level, the lines are painted in aquamarine. Otherwise, the lines are gray. Colored dots on lines appear when the bar of the corresponding timeframe changes.
Fig.1. The MultiCMxTrend_x10 indicator