![MACD Histogram, multi-timeframe, multi-color [v03]](/images/10851.webp)
MACD Histogram, multi-timeframe, multi-color [v03]
This is a powerful addition to your MetaTrader 5 toolkit designed to optimize market analysis and performance. This technical indicator acts as a specialized analysis tool designed to visualize market data. It helps traders identify emerging trends, momentum shifts, and key support or resistance levels by plotting statistical calculations directly onto price charts.
How to Setup and Use MACD Histogram, multi-timeframe, multi-color [v03]
1. Installation: Place your file in the MQL/Indicators folder via "Open Data Folder" and restart your terminal.
2. Loading: Find the indicator in the Navigator, drag it onto your chart, and configure the input parameters in the popup window.
3. Customization: Press Ctrl+I to open the indicator list, select your tool, and click "Properties" to change colors, levels, or visual styles.
4. Updating: Replace the old file in the Indicators folder with the new version and restart the platform to apply changes.
Frequently Asked Questions
Q: Why is my indicator not showing? A: Verify the file is in the MQL/Indicators folder, or try right-clicking the "Indicators" tree in the Navigator and clicking "Refresh."
Q: Do custom indicators slow down the platform? A: Too many complex indicators can impact performance; remove unused ones via the "Indicator List" (Ctrl+I).
Q: Can I use MT4 indicators on MT5? A: No, MQL4 and MQL5 are distinct languages; ensure the indicator is compiled specifically for your platform version.
Description & Settings
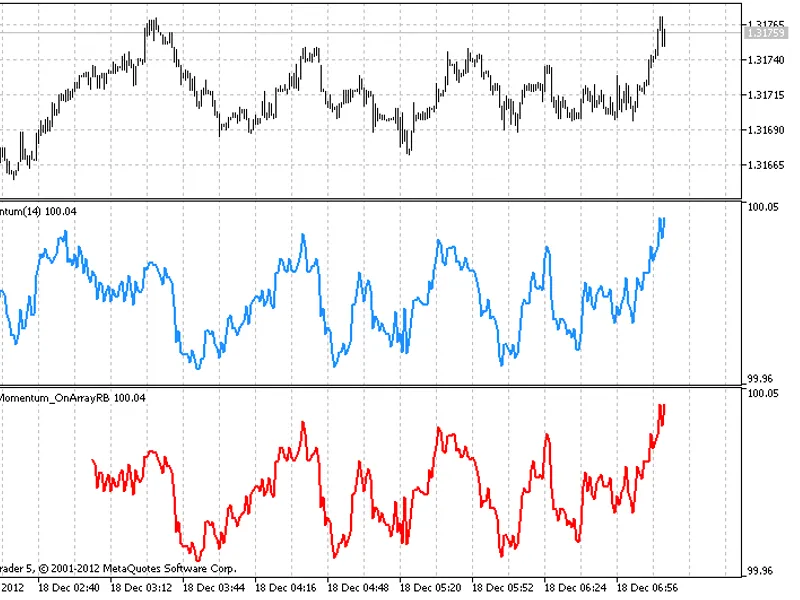
This
MACD
indicator can be applied to any timeframe, higher or lower than the current chart's timeframe.
The values can be calculated based on any of the usual price types. When the indicator is applied to a timeframe lower than the current chart's time frame it's not possible to display all values. In this case, depending on the price type chosen, it will use a different approach to give the most appropriate value.
Two examples:
timeframe_1=5 minutes, timeframe_2=1 minute, calculations based on
Close
price series:
For any bar on timeframe_1, the indicator will show the latest bar of timeframe_2 with a Close time before or at the Close time of the bar at timeframe_1. This goes for bars that have been closed as well as the current bar that's still open.
timeframe_1=5 minutes, timeframe_2=1 minute, calculations based on
Open
price series:
For any bar at timeframe_1, the indicator will show the latest bar of timeframe_2 with a opening time before or at the Open time of the bar on timeframe_1. This goes for bars that have been closed as well as the current bar that's still open. The logic here is that if you choose to calculate your indicators on the Open time of a bar then probably you will also trade when a new bar opens. In that case, at the Open of a new 5-minute bar, you will only know the Open of the first of the five 1-minute bars that are part of it. The Open of the second to fifth 1-minute bars are therefore ignored in the calculations.
You can mix any time frame with any other time frame, even if they are not in sync, e.g. timeframe_1 = 5 minutes and timeframe_2 = 12 minutes. The indicator will make sure they stay synced. The way this works is similar to the examples above.
The attached excel sheet (
Conversion between timeframes.zip
) contains examples of all the possible types of combinations and a more visual explanation. Also take a look at the source code to see how it's done. Hopefully it will help you build your own multi-timeframe indicators.
When switching between time frames, allow some time (a few seconds) for the price data to be loaded. If the indicator is not displayed, refresh the chart manually.
Requires:
MovingAverages.mqh
(default include file in terminal_data_folder\MQL5\Include folder)
MACD_Histogram_MC
(also posted at mql5.com)
Put both
MACD Histogram_MTF_MC.mq5
and
MACD_Histogram_MC.mq5
in the terminal_data_folder\MQL5\Indicators for the indicator to work.
Look in the source to switch on/off error messages:
bool
ShowErrorMessages=
false
;
// turn on/off error messages for debugging
Update history:
2010 09 26: v03
Improved display of values on timeframes smaller than the chart's timeframe;
Set buffers to EMPTY_VALUE instead of 0 after: if(convertedTime<tempTimeArray_TF2[0]);
Code optimization;
Removed PLOT_DRAW_BEGIN from OnInit() - inherited from single time frame indicator;
Moved ArraySetAsSeries of buffers and arrays into OnInit();
Added MODE_SMMA and MODE_LWMA as MA methods for Signal line;
Made ENUM_APPLIED_PRICE the last input parameter on the list;
2010 08 28: v02B
Indicator first published;