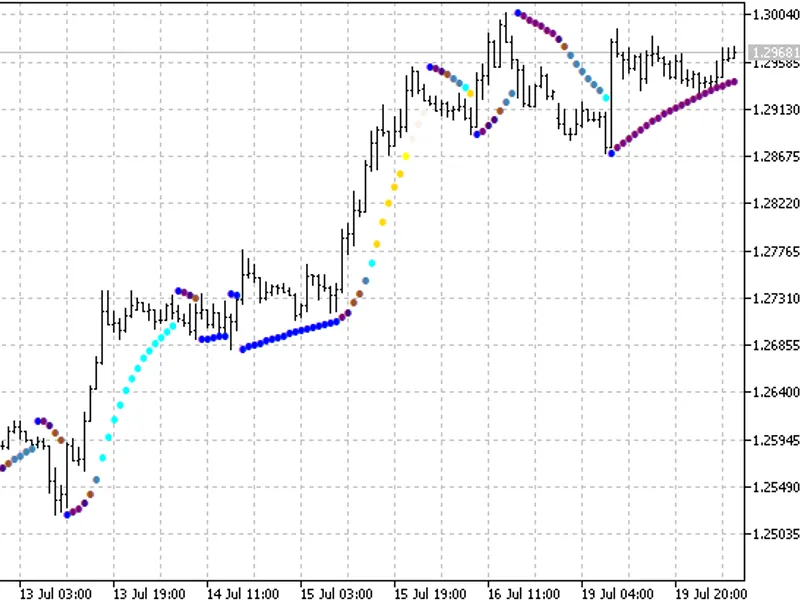
Momentum
This is a powerful addition to your MetaTrader 4 toolkit designed to optimize market analysis and performance. This technical indicator acts as a specialized analysis tool designed to visualize market data. It helps traders identify emerging trends, momentum shifts, and key support or resistance levels by plotting statistical calculations directly onto price charts.
How to Setup and Use Momentum
1. Installation: Place your file in the MQL/Indicators folder via "Open Data Folder" and restart your terminal.
2. Loading: Find the indicator in the Navigator, drag it onto your chart, and configure the input parameters in the popup window.
3. Customization: Press Ctrl+I to open the indicator list, select your tool, and click "Properties" to change colors, levels, or visual styles.
4. Updating: Replace the old file in the Indicators folder with the new version and restart the platform to apply changes.
Frequently Asked Questions
Q: Why is my indicator not showing? A: Verify the file is in the MQL/Indicators folder, or try right-clicking the "Indicators" tree in the Navigator and clicking "Refresh."
Q: Do custom indicators slow down the platform? A: Too many complex indicators can impact performance; remove unused ones via the "Indicator List" (Ctrl+I).
Q: Can I use MT4 indicators on MT5? A: No, MQL4 and MQL5 are distinct languages; ensure the indicator is compiled specifically for your platform version.
Description & Settings
The Momentum Technical Indicator measures the change of price of a financial instrument over a given time span.
Momentum
There are basically two ways to use the Momentum indicator:
As a trend-following indicator similar to the Moving Average Convergence/Divergence (MACD) indicator. In this case a signal to buy occurs if the Momentum indicator makes up a trough and starts rising; a signal to sell occurs when it reaches peak and turns down. You may want to plot a short-term moving average of the indicator to determine when it is bottoming or peaking. Extremely high or low values of Momentum imply continuation of the current trend. Thus if the indicator reaches extremely high values and then turns down, the further price growth should be expected. In any case, a position should be opened or closed only after prices confirm the signal generated by the indicator.
As a leading indicator. This method assumes that the final phase of an up-trend is usually accompanied by a rapid price increase (when everyone expects prices to go higher), and that the end of bears' market is characterized by rapid price declines (when everyone wants to get out). This is often the case, but it is also a broad generalization. When market approaches a peak there is a sharp leap of the Momentum indicator. After that it starts to fall while prices keep on growing or move horizontally. Analogous to that, at the market bottom Momentum sharply falls and then turns up long before prices start growing. Both of these situations result in divergences between the indicator and prices.
Calculation
Momentum is calculated as a ratio of today’s price to the price n periods ago: MOMENTUM = CLOSE (i) / CLOSE (i - n) * 100
Where: CLOSE (i) — the close price of the current bar; CLOSE (i - n) — the close price n bars ago.
Description of the technical indicator
The full description of the Momentum is available in the Technical analysis: Momentum section