Wilder's Volaility System
This professional-grade solution for MetaTrader 4 helps traders achieve greater efficiency in their daily workflow. This technical indicator acts as a specialized analysis tool designed to visualize market data. It helps traders identify emerging trends, momentum shifts, and key support or resistance levels by plotting statistical calculations directly onto price charts.
How to Setup and Use Wilder's Volaility System
1. Installation: Place your file in the MQL/Indicators folder via "Open Data Folder" and restart your terminal.
2. Loading: Find the indicator in the Navigator, drag it onto your chart, and configure the input parameters in the popup window.
3. Customization: Press Ctrl+I to open the indicator list, select your tool, and click "Properties" to change colors, levels, or visual styles.
4. Updating: Replace the old file in the Indicators folder with the new version and restart the platform to apply changes.
Frequently Asked Questions
Q: Why is my indicator not showing? A: Verify the file is in the MQL/Indicators folder, or try right-clicking the "Indicators" tree in the Navigator and clicking "Refresh."
Q: Do custom indicators slow down the platform? A: Too many complex indicators can impact performance; remove unused ones via the "Indicator List" (Ctrl+I).
Q: Can I use MT4 indicators on MT5? A: No, MQL4 and MQL5 are distinct languages; ensure the indicator is compiled specifically for your platform version.
Description & Settings
Wilder's Volatility System
Wilder’s Volatility System, developed by and named after Welles Wilder, is a volatility index made up of the ongoing calculated average, the True Range. The True Range is always positive and is defined as the highest difference in value among today’s daily high minus today’s daily low; today’s daily high minus yesterday’s closing price; and today’s low minus yesterday’s closing price. The consideration of the True Range means that days with a low trading range (little difference between daily high and low), but still showing a clear price difference to the previous day, do not enter into the calculation with an erroneously low volatility.
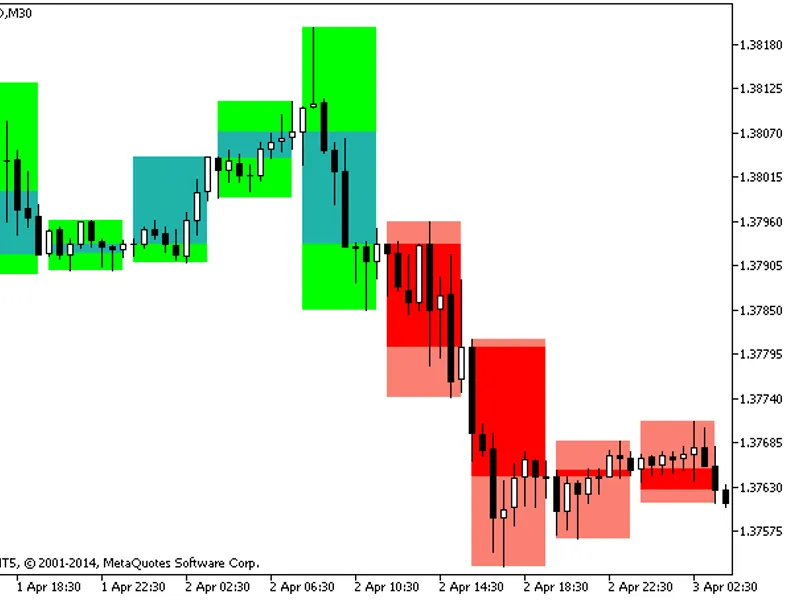
Interpretation
Wilder’s Volatility System determines market volatility by calculating a smoothed average of the market price’s true range. True Range, developed by Welles Wilder to deliver a more realistic method to calculate price activity, is an indicator that measures price activity and directional movement and is defined as the distance a price moves per increment of time, e.g. from the lowest price to the highest price in a day. This system measures the trend in volatility in the base instrument, according to the True Range concept. A rising trend line shows a volatility increase in the security. A falling trend line shows a reduction in the instrument’s volatility. The ordinate values are not relevant.
Wilder’s Volatility System alone cannot trigger any trade signals, which means it must be used in conjunction with other indicator systems. A popular use is, for example, the Volatility Breakout System. Average True Range (ATR) represents the foundation for this. The aim of this system is to open a long position, as soon as the base instrument rises above its usual fluctuation margin and a short position as soon as it falls below its usual fluctuation margin.
The Volatility assists the trader in determining the market’s risk potential, as well as buy and sell opportunities. More volatile markets offer a greater risk/reward potential. There are traders who readily take on the risk for the potential of a greater profit, while, at the same time, there are traders who do not want to take such a risk.

![[EA] Charles-1. 3. 3](/images/10768.webp)