R - Squared indicator
This is a powerful addition to your MetaTrader 4 toolkit designed to optimize market analysis and performance. This technical indicator acts as a specialized analysis tool designed to visualize market data. It helps traders identify emerging trends, momentum shifts, and key support or resistance levels by plotting statistical calculations directly onto price charts.
How to Setup and Use R - Squared indicator
1. Installation: Place your file in the MQL/Indicators folder via "Open Data Folder" and restart your terminal.
2. Loading: Find the indicator in the Navigator, drag it onto your chart, and configure the input parameters in the popup window.
3. Customization: Press Ctrl+I to open the indicator list, select your tool, and click "Properties" to change colors, levels, or visual styles.
4. Updating: Replace the old file in the Indicators folder with the new version and restart the platform to apply changes.
Frequently Asked Questions
Q: Why is my indicator not showing? A: Verify the file is in the MQL/Indicators folder, or try right-clicking the "Indicators" tree in the Navigator and clicking "Refresh."
Q: Do custom indicators slow down the platform? A: Too many complex indicators can impact performance; remove unused ones via the "Indicator List" (Ctrl+I).
Q: Can I use MT4 indicators on MT5? A: No, MQL4 and MQL5 are distinct languages; ensure the indicator is compiled specifically for your platform version.
Description & Settings
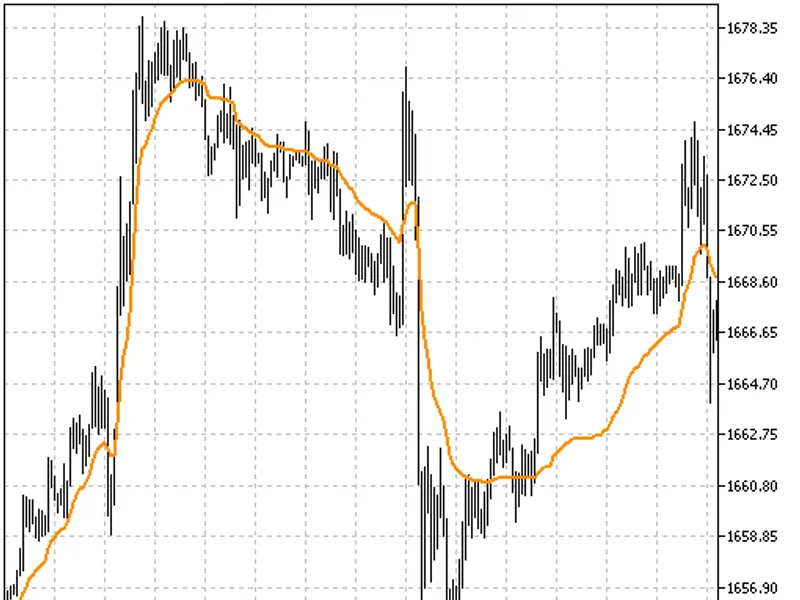
R-Squared shows the correlation with its linear regression line values close to 1.0 show perfect relation values close to 0.0 show poor relation.
See Metastock Help.
To determine if the trend is statistically significant for a given x-period linear regression line, plot the r-squared indicator and refer to the following table. This table shows the values of r-squared required for a 95% confidence level at various time periods. If the r-squared value is less than the critical values shown, you should assume that prices show no statistically significant trend.
Number ofPeriods r-squaredCritical Value(95%confidence):
5 0.77 10 0.40 14 0.27 20 0.20 25 0.16 30 0.13 50 0.08 60 0.06 120 0.03
You may even consider opening a short-term position opposite the prevailing trend when you observe r-squared rounding off at extreme levels. For example, if the slope is positive and r-squared is above 0.80 and begins to turn down, you may consider selling or opening a short position.There are numerous ways to use the linear regression outputs of r-squared and Slope in trading systems. For more detailed coverage, refer to the book The New Technical Trader by Tushar Chande and Stanley Kroll.