Indicator Bo Di
This software component for MetaTrader 4 is built to enhance the capabilities of your trading environment. This technical indicator acts as a specialized analysis tool designed to visualize market data. It helps traders identify emerging trends, momentum shifts, and key support or resistance levels by plotting statistical calculations directly onto price charts.
How to Setup and Use Indicator Bo Di
1. Installation: Place your file in the MQL/Indicators folder via "Open Data Folder" and restart your terminal.
2. Loading: Find the indicator in the Navigator, drag it onto your chart, and configure the input parameters in the popup window.
3. Customization: Press Ctrl+I to open the indicator list, select your tool, and click "Properties" to change colors, levels, or visual styles.
4. Updating: Replace the old file in the Indicators folder with the new version and restart the platform to apply changes.
Frequently Asked Questions
Q: Why is my indicator not showing? A: Verify the file is in the MQL/Indicators folder, or try right-clicking the "Indicators" tree in the Navigator and clicking "Refresh."
Q: Do custom indicators slow down the platform? A: Too many complex indicators can impact performance; remove unused ones via the "Indicator List" (Ctrl+I).
Q: Can I use MT4 indicators on MT5? A: No, MQL4 and MQL5 are distinct languages; ensure the indicator is compiled specifically for your platform version.
Description & Settings
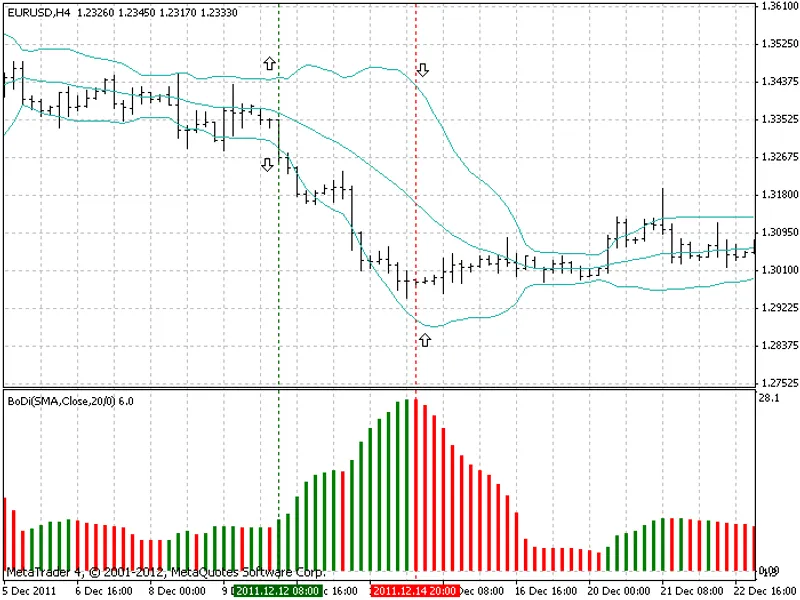
The presented indicator is prepared on the basis of well known indicator Bollinger Bands. In short, Bollinger Bands consists of two lines that are situated above and below of moving average plotted of a certain number of standard deviations away from it. In case of high volatility lines become wider, during less volatile periods they become narrower. So, these bands show borders of possible price movement. Observation of the Bollinger’s behavior has revealed another interesting pattern. The widening of the channel indicates the formation of bullish or bearish type of the price movement. In my opinion it is not possible to find the starting point of such movement, because as a rule it becomes clear at the end. However, this moment may be adopted to find the point of extinction of the impulse. Figure 1 shows that the narrowing of the Bollinger Bands channel is correlated with the moment of the break in struggle between bears and bulls. For trader’s convenience, it is prepared indicator, which calculates difference between upper and lower lines of Bollinger Bands, which is plotted in a separate window as a histogram. Because of the lack the description in the literature the indicator with a similar algorithm, for the purpose of this publication I decided to call it BoDi (Bollinger's Difference) (Fig. 1).
Fig. 1. Indicator Bollinger Bands (on the chart) and BoDi (under chart)
Indicator is calculated on the following formulas: 1. Bollinger Bands:
where:
D - number of standard deviations,
y - price for i bar,
n - number of periods used for calculations,
UpperBB and LoweBB - upper and lower lines of Bollinger Bands.
2. BoDi:
where:
1000 - coefficient for better visualization.
This indicator better to use on currencies with impulse behavior. Figure 1 shows that when price moves rapidly bands of Bollinger become wider and histogram of BoDi becomes green. In turn, when price movement slows the difference between Bollinger bands become narrower that is visible on BoDi’s histogram, which is colored to red. This moment can be treated as a signal to close position or partial close or to move stop-loss to the open price level. Indicator BoDi I can recommend as an additional tool to find exit points in trend and breakout type of trading (Fig. 2).
Figure 2. Examples of finding exit points.
For those who uses expert advisers I may propose the following algorithm for finding point to close position:
where:
[1] - index of the bar relative to the current (zero) bar,
n - number of the last bar used in calculation,
k - ratio of the second bar [2] to the last bar [n].
I recommend to calculate BoDi on the basis of exponential moving average (EMA), period 20 and typical price.