Ichimoku Kinko Hyo
This is a powerful addition to your MetaTrader 4 toolkit designed to optimize market analysis and performance. This technical indicator acts as a specialized analysis tool designed to visualize market data. It helps traders identify emerging trends, momentum shifts, and key support or resistance levels by plotting statistical calculations directly onto price charts.
How to Setup and Use Ichimoku Kinko Hyo
1. Installation: Place your file in the MQL/Indicators folder via "Open Data Folder" and restart your terminal.
2. Loading: Find the indicator in the Navigator, drag it onto your chart, and configure the input parameters in the popup window.
3. Customization: Press Ctrl+I to open the indicator list, select your tool, and click "Properties" to change colors, levels, or visual styles.
4. Updating: Replace the old file in the Indicators folder with the new version and restart the platform to apply changes.
Frequently Asked Questions
Q: Why is my indicator not showing? A: Verify the file is in the MQL/Indicators folder, or try right-clicking the "Indicators" tree in the Navigator and clicking "Refresh."
Q: Do custom indicators slow down the platform? A: Too many complex indicators can impact performance; remove unused ones via the "Indicator List" (Ctrl+I).
Q: Can I use MT4 indicators on MT5? A: No, MQL4 and MQL5 are distinct languages; ensure the indicator is compiled specifically for your platform version.
Description & Settings
Ichimoku Kinko Hyo Technical Indicator is predefined to characterize the market Trend, Support and Resistance Levels, and to generate signals of buying and selling. This indicator works best at weekly and daily charts.
When defining the dimension of parameters, four time intervals of different length are used. The values of individuallines composing this indicator are based on these intervals:
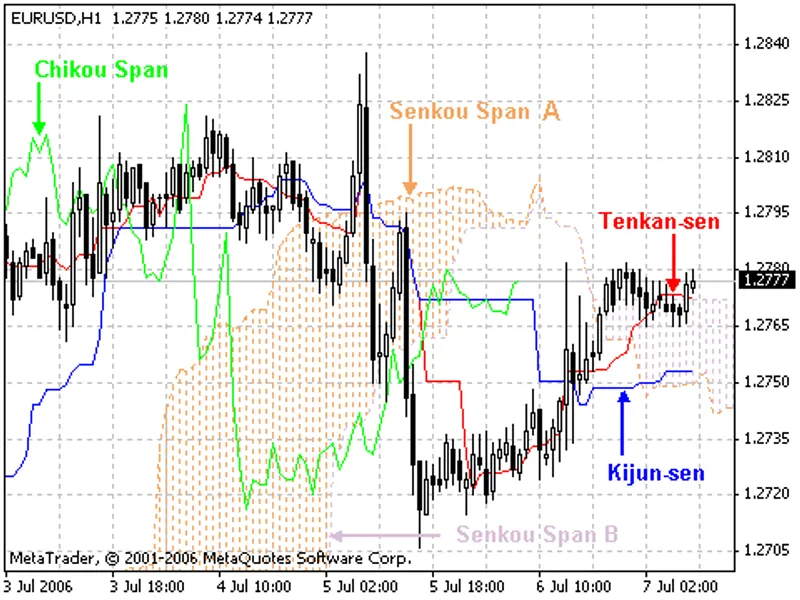
Tenkan-sen shows the average price value during the first time interval defined as the sum of maximum and minimum within this time, divided by two;
Kijun-sen shows the average price value during the second time interval;
Senkou Span A shows the middle of the distance between two previous lines shifted forwards by the value of the second time interval;
Senkou Span B shows the average price value during the third time interval shifted forwards by the value of the second time interval.
Chikou Span shows the closing price of the current candle shifted backwards by the value of the second time interval. The distance between the Senkou lines is hatched with another color and called "cloud". If the price is between these lines, the market should be considered as non-trend, and then the cloud margins form the support and resistance levels.
If the price is above the cloud, its upper line forms the first support level, and the second line forms the second support level;
If the price is below cloud, the lower line forms the first resistance level, and the upper one forms the second level;
If the Chikou Span line traverses the price chart in the bottom-up direction it is signal to buy. If the Chikou Span line traverses the price chart in the top-down direction it is signal to sell.
Kijun-sen is used as an indicator of the market movement. If the price is higher than this indicator, the prices will probably continue to increase. When the price traverses thisline the further trend changing is possible.
Another kind of using the Kijun-sen is giving signals. Signal to buy is generated when the Tenkan-sen line traverses the Kijun-sen in the bottom-up direction. Top-down direction is the signal to sell.
Tenkan-sen is used as an indicator of the market trend. If this line increases or decreases, the trend exists. When it goes horizontally, it means that the market has come intothe channel.
Technical Indicator Description
Full description of Ishimoku is available in the Technical analysis: Ichimoku Kinko Hyo