MA C D Ichimoku
This tool for MetaTrader 4 is specifically engineered to streamline your trading operations. This technical indicator acts as a specialized analysis tool designed to visualize market data. It helps traders identify emerging trends, momentum shifts, and key support or resistance levels by plotting statistical calculations directly onto price charts.
How to Setup and Use MA C D Ichimoku
1. Installation: Place your file in the MQL/Indicators folder via "Open Data Folder" and restart your terminal.
2. Loading: Find the indicator in the Navigator, drag it onto your chart, and configure the input parameters in the popup window.
3. Customization: Press Ctrl+I to open the indicator list, select your tool, and click "Properties" to change colors, levels, or visual styles.
4. Updating: Replace the old file in the Indicators folder with the new version and restart the platform to apply changes.
Frequently Asked Questions
Q: Why is my indicator not showing? A: Verify the file is in the MQL/Indicators folder, or try right-clicking the "Indicators" tree in the Navigator and clicking "Refresh."
Q: Do custom indicators slow down the platform? A: Too many complex indicators can impact performance; remove unused ones via the "Indicator List" (Ctrl+I).
Q: Can I use MT4 indicators on MT5? A: No, MQL4 and MQL5 are distinct languages; ensure the indicator is compiled specifically for your platform version.
Description & Settings
The MACD is one of the stable indicators around which many strategies have been developed.
In an attempt to apply some market sentiment indications to it I decided to apply the Ichimoku concepts to it's values.
Instead of re writing how to use Ichimoku I suggest you have a look at an extremely good source of information
at and you can then read this indicator with a full understanding.
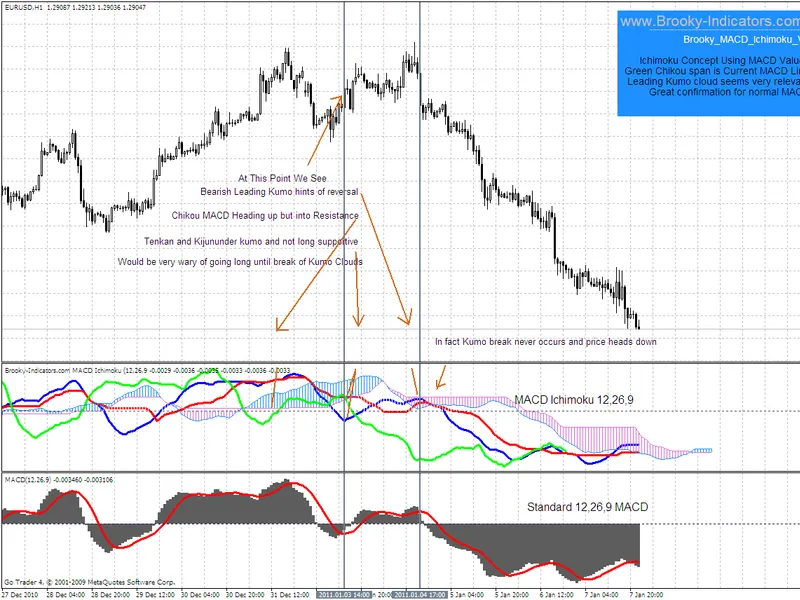
On the attached chart I have noted a basic view on a movement just to give you an idea of how one may read the information presented.
The indicator itself uses the same auto shading code that I use to make shades float and you will need to allow dll's for that to occur and wait for a new tick or
right click and edit without changing anything and close again on a stationary chart for clouds to float.
Because we are dealing with positive and negative values in MACD, I am constrained with the amount of buffers that I can use to allow shading of every
possibility. This means that while you will always see the SenkouA and B lines, (Boundaries of the Kumo Clouds), occasionally a small amount of shading is clear
when zero line crossovers occur. Nothing to worry about but worth mentioning.
For me this is quite a new way of confirming MACD and I am very happy with the overall information presented. Ichimoku is a bit of a learning curve but a very worthwhile
pursuit and I believe this indicator would be similar. A bit daunting at first but worth the exercise.
Initially I just ran the M5 and M15 strategy tester with a do nothing EA and watched and noted how the indi behaved. After a while you will be surprised how well it tells the story.
I have nearly completed the Stochastic and CCI Ichimokus and released the ADX_Ichimoku on my site a while ago.
Cheers
Brooky