Hull Moving Average
This tool for MetaTrader 4 is specifically engineered to streamline your trading operations. This technical indicator acts as a specialized analysis tool designed to visualize market data. It helps traders identify emerging trends, momentum shifts, and key support or resistance levels by plotting statistical calculations directly onto price charts.
How to Setup and Use Hull Moving Average
1. Installation: Place your file in the MQL/Indicators folder via "Open Data Folder" and restart your terminal.
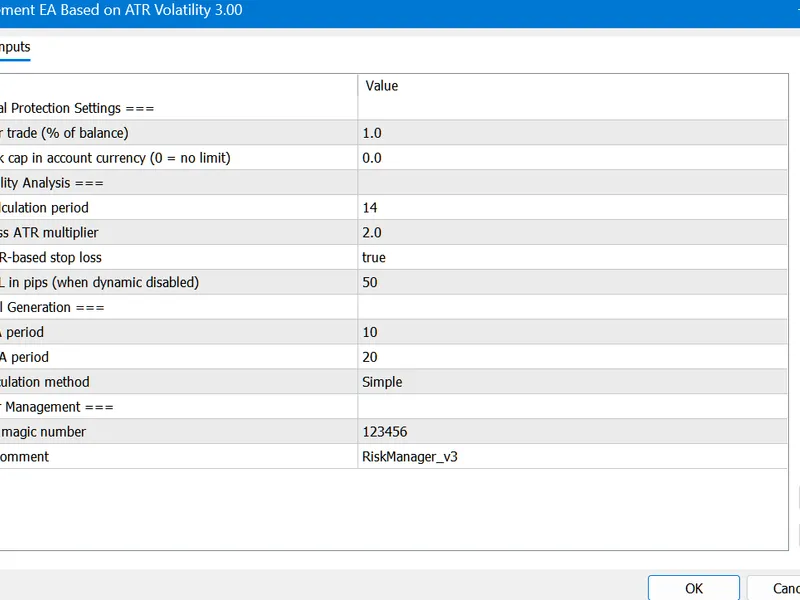
2. Loading: Find the indicator in the Navigator, drag it onto your chart, and configure the input parameters in the popup window.
3. Customization: Press Ctrl+I to open the indicator list, select your tool, and click "Properties" to change colors, levels, or visual styles.
4. Updating: Replace the old file in the Indicators folder with the new version and restart the platform to apply changes.
Frequently Asked Questions
Q: Why is my indicator not showing? A: Verify the file is in the MQL/Indicators folder, or try right-clicking the "Indicators" tree in the Navigator and clicking "Refresh."
Q: Do custom indicators slow down the platform? A: Too many complex indicators can impact performance; remove unused ones via the "Indicator List" (Ctrl+I).
Q: Can I use MT4 indicators on MT5? A: No, MQL4 and MQL5 are distinct languages; ensure the indicator is compiled specifically for your platform version.
Description & Settings
The Hull Moving Average (HMA), developed by Alan Hull, is an extremely fast and smooth Moving Average that almost eliminates lag altogether and manages to improve smoothing at the same time. For that, Alan wrote an equation for the calculation of this Moving Average like this:
With this clever equation, Alan got a very fast Moving Average that it is much more reactive to the price action.
For a full explanation of how it works you can visit:
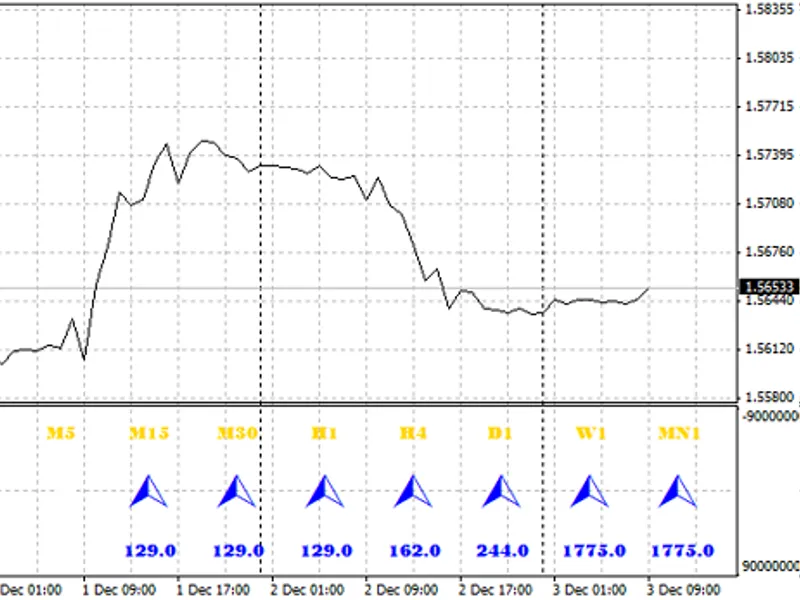
You can use it in two main ways:
Using only one HMA: When the HMA change its slope, this is a good time to be ready for entry long or short depending of the direction of the slope change. Always look for a good setup, like candlestick pattern or breakout of support-resistance zone.
Using two HMAs: with the typical cross of averages, e.g. HMA(9) and HMA(25). Considering the same that is said above. Also you can use it like out signal when it changes its slope (when you use only one HMA or when you use two with the change in the slope of the fast HMA). Like all moving averages, it does not work well in range markets because it gives many false entries.
I have made the code so you can change the type of Moving Average used in the calculations (but this already would not be a real Hull Moving Average) and the applied price. I like to use the typical price to take into account what has happened in each candle.
In the code, in the part "Custom indicator initialization function", you will see the line:
If you write DRAW_LINE, you will see another line on the chart that represent this part of the equation:
This is the calculation previous to the HMA calculus, but without the smoothing effect of applying a Moving Average to a Moving Average. You can use these lines like the use of two HMAs of different periods.