Heikin Ashi Lines
This tool for MetaTrader 4 is specifically engineered to streamline your trading operations. This technical indicator acts as a specialized analysis tool designed to visualize market data. It helps traders identify emerging trends, momentum shifts, and key support or resistance levels by plotting statistical calculations directly onto price charts.
How to Setup and Use Heikin Ashi Lines
1. Installation: Place your file in the MQL/Indicators folder via "Open Data Folder" and restart your terminal.
2. Loading: Find the indicator in the Navigator, drag it onto your chart, and configure the input parameters in the popup window.
3. Customization: Press Ctrl+I to open the indicator list, select your tool, and click "Properties" to change colors, levels, or visual styles.
4. Updating: Replace the old file in the Indicators folder with the new version and restart the platform to apply changes.
Frequently Asked Questions
Q: Why is my indicator not showing? A: Verify the file is in the MQL/Indicators folder, or try right-clicking the "Indicators" tree in the Navigator and clicking "Refresh."
Q: Do custom indicators slow down the platform? A: Too many complex indicators can impact performance; remove unused ones via the "Indicator List" (Ctrl+I).
Q: Can I use MT4 indicators on MT5? A: No, MQL4 and MQL5 are distinct languages; ensure the indicator is compiled specifically for your platform version.
Description & Settings
Probably everyone has put up a Heikin Ashi chart one time or another. It makes it look so much cleaner with less noise and clearer trends.
But there is one major flaw — it hides the true bar/candle values, especially the true closing prices.
The Heikin Ashi close price is simply an applied price called the “total price”, and the Heikin Ashi open is simply a moving average of its close prices.
So, why not just display it as two lines instead?
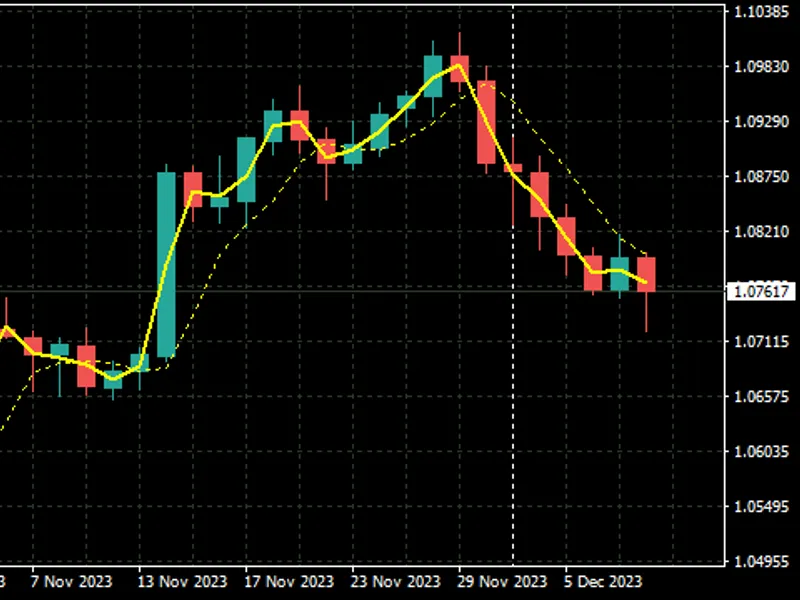
This is what this indicator does. That way, you can still see the true bar/candle values. The dotted line is the open and the solid is the close.
Please note that by default it will use Gray/Gey as the line colour, which is dull. So use the colour that best suits you, for example Yellow on a black background or Blue on a white background.
The code uses conditional compilation and will compile on both MQL4 and MQL5. Please note that all my CodeBase publications’ source code are now also available in “Public Projects” tab of MetaEditor under the name “FMIC”.