Stochastic Oscillator
This tool for MetaTrader 4 is specifically engineered to streamline your trading operations. This technical indicator acts as a specialized analysis tool designed to visualize market data. It helps traders identify emerging trends, momentum shifts, and key support or resistance levels by plotting statistical calculations directly onto price charts.
How to Setup and Use Stochastic Oscillator
1. Installation: Place your file in the MQL/Indicators folder via "Open Data Folder" and restart your terminal.
2. Loading: Find the indicator in the Navigator, drag it onto your chart, and configure the input parameters in the popup window.
3. Customization: Press Ctrl+I to open the indicator list, select your tool, and click "Properties" to change colors, levels, or visual styles.
4. Updating: Replace the old file in the Indicators folder with the new version and restart the platform to apply changes.
Frequently Asked Questions
Q: Why is my indicator not showing? A: Verify the file is in the MQL/Indicators folder, or try right-clicking the "Indicators" tree in the Navigator and clicking "Refresh."
Q: Do custom indicators slow down the platform? A: Too many complex indicators can impact performance; remove unused ones via the "Indicator List" (Ctrl+I).
Q: Can I use MT4 indicators on MT5? A: No, MQL4 and MQL5 are distinct languages; ensure the indicator is compiled specifically for your platform version.
Description & Settings
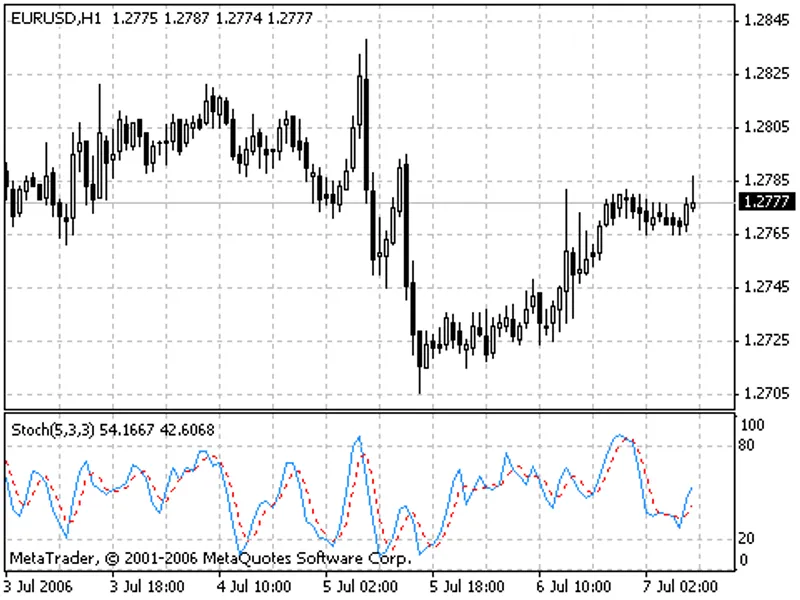
The Stochastic Oscillator Technical Indicator compares where a security’s price closed relative to its price range over a given time period.
The Stochastic Oscillator is displayed as two lines. The main line is called %K. The second line, called %D, is a Moving Average of %K. The %K line is usually displayed as a solid line and the %D line is usually displayed as a dotted line.
There are several ways to interpret a Stochastic Oscillator. Three popular methods include:
Buy when the Oscillator (either %K or %D) falls below a specific level (e.g., 20) and then rises above that level. Sell when the Oscillator rises above a specific level (e.g., 80) and then falls below that level;
Buy when the %K line rises above the %D line and sell when the %K line falls below the %D line;
Look for divergences. For instance: where prices are making a series of new highs and the Stochastic Oscillator is failing to surpass its previous highs.
Calculation
The Stochastic Oscillator has three variables:
%K periods (Pk). This is the number of time periods used in %K calculation. By default is 5;
%K Slowing Periods (Sk). This value controls the internal smoothing of %K. A value of 1 is considered a fast stochastic; a value of 3 is considered a slow stochastic. By default is 3;
%D periods (Pd). This is the number of time periods used when calculating a moving average of %K. By default is 3;
The formula for %K is:
%K = 100*SUM (CLOSE - MIN (LOW, Pk), Sk) / SUM (MAX (HIGH, Pk) - MIN (LOW, Pk)), Sk)
Where:
CLOSE — is today’s closing price;
MIN (LOW, Pk) — is the lowest low in Pk periods;
MAX (HIGH, Pk) — is the highest high in Pk periods;
SUM (CLOSE - MIN (LOW, Pk), Sk) — amount composed CLOSE - MIN (LOW, Pk) for period Sk;
SUM (MAX (HIGH, Pk) - MIN (LOW, Pk)), Sk) — amount composed HIGH (Pk)) - MIN (LOW, Pk) for period Sk.
The %D moving average is calculated according to the formula:
%D = SMA (%K, Pd)
where:
Pd — is the smoothing period for %K;
SMA — is the Simple Moving Average.
Technical Indicator Description
Full description of Stochastic is available in the Technical analysis: Stochastic Oscillator