Guppy (Long and Short)
This professional-grade solution for MetaTrader 4 helps traders achieve greater efficiency in their daily workflow. This technical indicator acts as a specialized analysis tool designed to visualize market data. It helps traders identify emerging trends, momentum shifts, and key support or resistance levels by plotting statistical calculations directly onto price charts.
How to Setup and Use Guppy (Long and Short)
1. Installation: Place your file in the MQL/Indicators folder via "Open Data Folder" and restart your terminal.
2. Loading: Find the indicator in the Navigator, drag it onto your chart, and configure the input parameters in the popup window.
3. Customization: Press Ctrl+I to open the indicator list, select your tool, and click "Properties" to change colors, levels, or visual styles.
4. Updating: Replace the old file in the Indicators folder with the new version and restart the platform to apply changes.
Frequently Asked Questions
Q: Why is my indicator not showing? A: Verify the file is in the MQL/Indicators folder, or try right-clicking the "Indicators" tree in the Navigator and clicking "Refresh."
Q: Do custom indicators slow down the platform? A: Too many complex indicators can impact performance; remove unused ones via the "Indicator List" (Ctrl+I).
Q: Can I use MT4 indicators on MT5? A: No, MQL4 and MQL5 are distinct languages; ensure the indicator is compiled specifically for your platform version.
Description & Settings
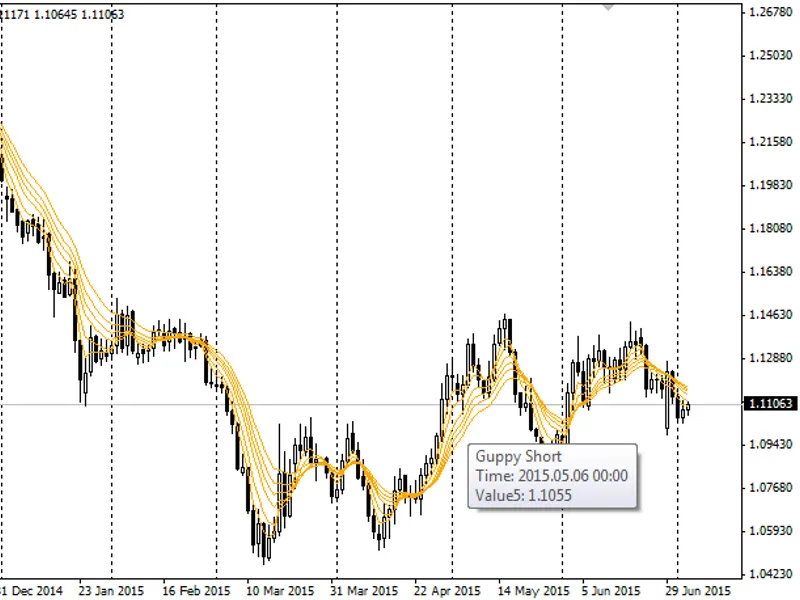
This indicator was developed by Daryl Guppy. It is composed by 6 EMAs of 3, 5, 8, 10, 12 and 15 periods which give you the direction and the strength of the short-term trend, the speculator trend. It is used in combination with other group of six EMAs which measures the direction and the strength of the long-term trend or the big-investor trend. This group of EMAs are of 30, 35, 40, 45, 50, 60 periods like Daryl Guppy say for daily timeframe. This indicator was made to analyze and trade on daily timeframe charts but can be used in other timeframes, like M15 or H1, with the same periods and setups.
I made these indicators so you can change the type of Moving Average, the period and applied price, i.e: high, low, open, close, typical and weighted price of the bars used to calculate the moving averages. You can change it on your own to trade in other timeframe that you feel more comfortable or to make the indicator more sensitive to little changes of the current trend.
Both group of EMAs can be used to measure the agreement or disagreement of these two types of traders: investors and speculator. This gives you a better understanding of this fight between them and the possibility of better entries in favor of the current trend or imminent changes on it.
For a explanation of how to use it you can visit:
I must say that when the two groups of EMAs are parallel and close together, both among themselves and between groups, investors and speculators are largely in agreement and a big move is very close. As I have read in "Market Wizards", it is like when in the past in a very crowded Wall Street the room was seized by silence with motionless prices, and a little time after, a wild move on them made people turn euphoric.
I have to say that I am not a programmer and I only made this indicator for myself, and now I want to share it.