Fractals Modified
This is a powerful addition to your MetaTrader 4 toolkit designed to optimize market analysis and performance. This technical indicator acts as a specialized analysis tool designed to visualize market data. It helps traders identify emerging trends, momentum shifts, and key support or resistance levels by plotting statistical calculations directly onto price charts.
How to Setup and Use Fractals Modified
1. Installation: Place your file in the MQL/Indicators folder via "Open Data Folder" and restart your terminal.
2. Loading: Find the indicator in the Navigator, drag it onto your chart, and configure the input parameters in the popup window.
3. Customization: Press Ctrl+I to open the indicator list, select your tool, and click "Properties" to change colors, levels, or visual styles.
4. Updating: Replace the old file in the Indicators folder with the new version and restart the platform to apply changes.
Frequently Asked Questions
Q: Why is my indicator not showing? A: Verify the file is in the MQL/Indicators folder, or try right-clicking the "Indicators" tree in the Navigator and clicking "Refresh."
Q: Do custom indicators slow down the platform? A: Too many complex indicators can impact performance; remove unused ones via the "Indicator List" (Ctrl+I).
Q: Can I use MT4 indicators on MT5? A: No, MQL4 and MQL5 are distinct languages; ensure the indicator is compiled specifically for your platform version.
Description & Settings
This indicator is a small modification of classical .
You can choose the number or left/right bars to have a new top or bottom as well a shift parameter.
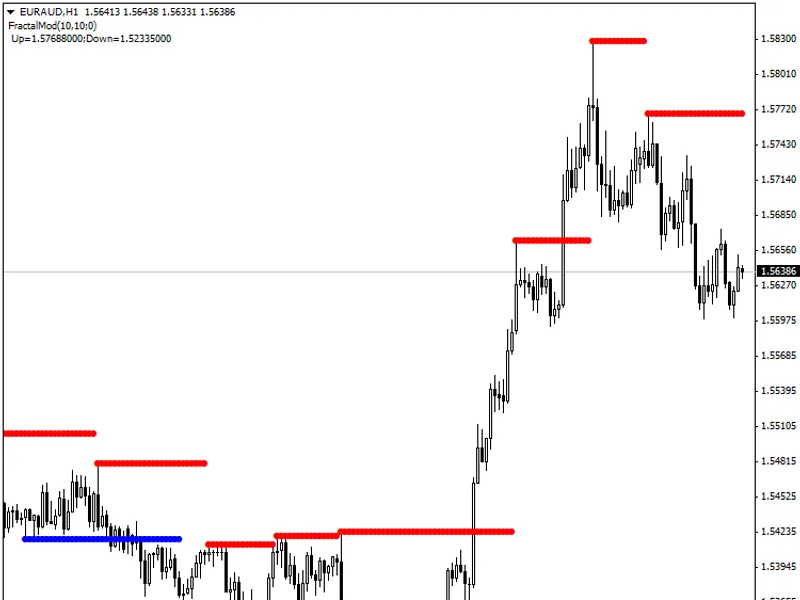
In the following chart you can see the indicator with parameter values:
leftbars=10;
rightbars=10;
shift=0.
The parameter leftbars/rightbars indicates the necessary number of bars to the left/right to have either a bottom or a top. Instead, the last parameter, shift, can be choosed to be 0 to have a good visualization of the top/bottom levels.
However, in order to use this indicator it should be convinient to choose it as maximum between leftbars and rightbars. It is in this moment when the top/bottom is created.
In the following chart you can see the same as before with parameters:
leftbars=10;
rightbars=10;
shift=10.
Remarks:
leftbars=10;
rightbars=10;
Note that the indicator is not defined for bars 0,...,rightbars. Therefore, in order to use this indicator in an EA you have to define either
or