Key Finder
This professional-grade solution for MetaTrader 5 helps traders achieve greater efficiency in their daily workflow. This script functions as a utility program designed for specific, one-time execution tasks. It is utilized to perform targeted actions, such as closing all open orders, managing chart objects, or executing custom administrative commands on demand.
How to Setup and Use Key Finder
1. Installation: Move your script file into the MQL/Scripts directory and restart the platform.
2. Execution: Drag the script onto a chart; it will perform a one-time action, such as closing all open orders or clearing chart objects.
3. Editing: Use MetaEditor (F4) to modify code, click "Compile," and verify no errors appear in the terminal before running.
4. Removing: Scripts stop automatically, but you can remove them manually by right-clicking the chart and choosing "Remove Script."
Frequently Asked Questions
Q: How are scripts different from EAs? A: Scripts execute a single action and then stop; EAs monitor the market and trade continuously.
Q: Can I assign a hotkey to a script? A: Yes, right-click the script in the Navigator, select "Set Hotkey," and define your preferred keyboard shortcut.
Q: Why did my script stop? A: Scripts are designed to stop immediately after finishing their programmed command; this is normal behavior.
Description & Settings
For a long time I studied and traded using the Thomas DeMark system, and used the indicator in the trading process.
My experience of trading identified one factor that causes quite poor trading results when building trends based on DeMark pivot points and Williams fractals.
Fig. 1. Key points determined using Williams fractals and their dimensions by DeMark
Let's remove the "not less" limit and count the number of bars to the left and to the right located lower/higher from the key point. The smallest value is the true dimension of the key point.
Fig. 2. True dimensions of the points
Using this approach we significantly change chart's appearance.
Fig. 3. RTS index futures contract chart
Now it's clear what DeMark meant when he said that trend lines should be built by points with same or close dimensions. Also, building a trend by points with different dimensions gives random results, and this is the reason why failures happen so often.
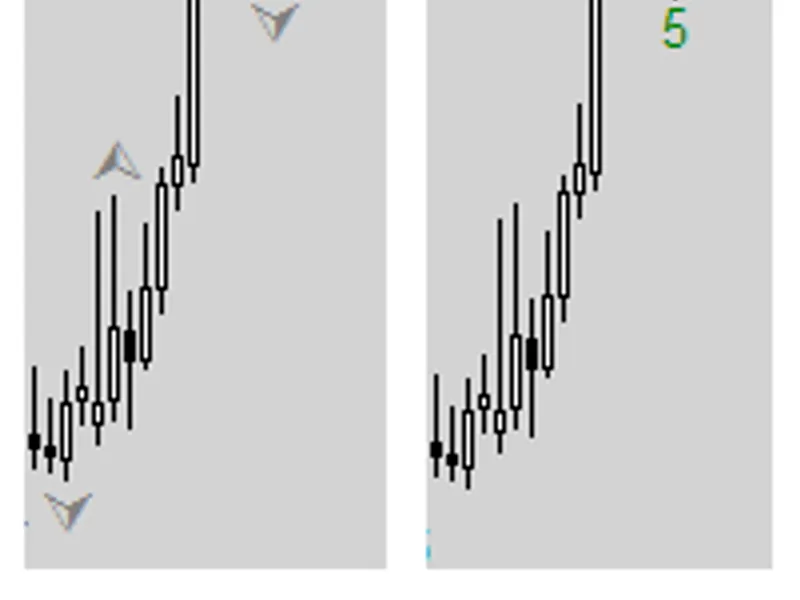
Fig. 4. Examples of trends
To facilitate the "correct" way of building trends, I wrote a script for the increasingly popular MetaTrader 5 platform. This script displays key points on the chart and shows their dimensions.
It's very easy to build trends with this script. An indicator is on the way!
About the script:
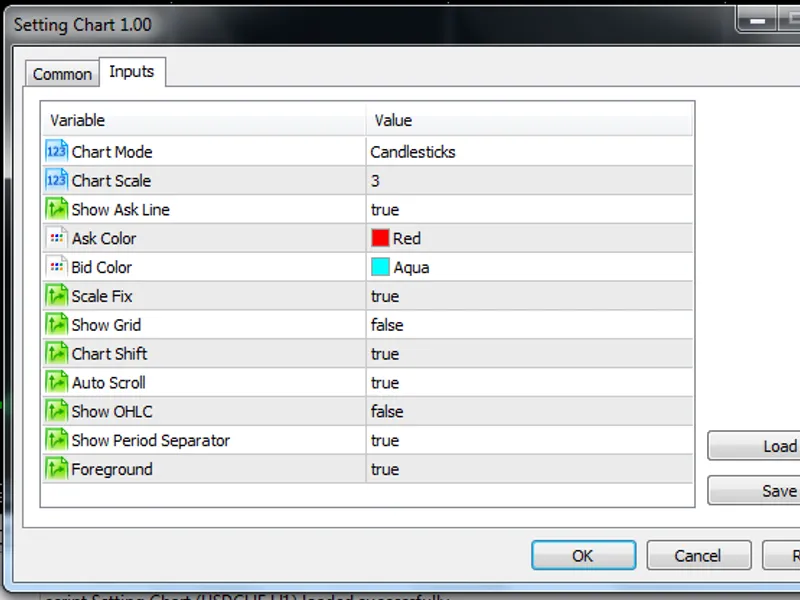
The script has only two adjustable parameters.
MinDimesion=5; - Minimum dimension allowed for displaying a key point on the chart.
MaxBars=300; - Maximum number of bars to process; this is the number of bars starting from the current bar that will be processed by the script.
The script uses loops to process the chart, that's why I don't recommend processing more than 1000 bars, as this may lead to a very high processing time. If the script cannot calculate the dimension of a certain point (e.g. because of limiting the number of bars to process), it marks such point with a colored ball.
I will appreciate any feedback, suggestions and comments. Good luck in trading!