Imbalance Finder (FV G)
This tool for MetaTrader 5 is specifically engineered to streamline your trading operations. This technical indicator acts as a specialized analysis tool designed to visualize market data. It helps traders identify emerging trends, momentum shifts, and key support or resistance levels by plotting statistical calculations directly onto price charts.
How to Setup and Use Imbalance Finder (FV G)
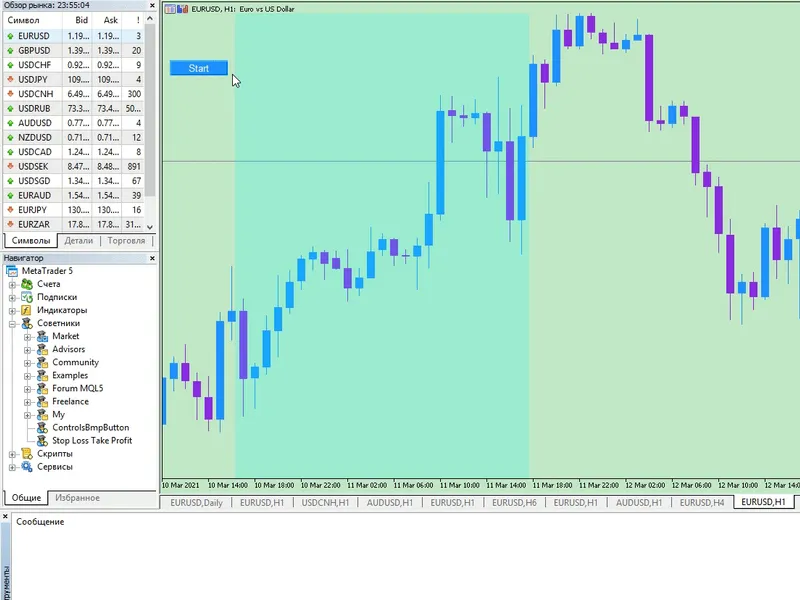
1. Installation: Place your file in the MQL/Indicators folder via "Open Data Folder" and restart your terminal.
2. Loading: Find the indicator in the Navigator, drag it onto your chart, and configure the input parameters in the popup window.
3. Customization: Press Ctrl+I to open the indicator list, select your tool, and click "Properties" to change colors, levels, or visual styles.
4. Updating: Replace the old file in the Indicators folder with the new version and restart the platform to apply changes.
Frequently Asked Questions
Q: Why is my indicator not showing? A: Verify the file is in the MQL/Indicators folder, or try right-clicking the "Indicators" tree in the Navigator and clicking "Refresh."
Q: Do custom indicators slow down the platform? A: Too many complex indicators can impact performance; remove unused ones via the "Indicator List" (Ctrl+I).
Q: Can I use MT4 indicators on MT5? A: No, MQL4 and MQL5 are distinct languages; ensure the indicator is compiled specifically for your platform version.
Description & Settings
The
Imbalance Finder
is a chart indicator for MetaTrader 5 that automatically detects
Fair Value Gaps (FVGs)
, also known as imbalances and visually tracks their lifecycle on the chart. It identifies both bullish and bearish imbalances and monitors in real time whether price has
tapped into
(partially filled) or
completely filled
each gap.
Fair Value Gaps are three-candle patterns where the wicks of the first and third candle do not overlap, leaving a price "gap" at the middle candle. These zones frequently act as support/resistance and are widely used in Smart Money Concepts (SMC) trading methodologies.
How It Works Detection Logic
The indicator examines every completed bar and compares the high/low of the surrounding candles:
Bullish FVG
: The low of bar [i] is above the high of bar [i-2]. The gap zone spans from high[i-2] (bottom) to low[i] (top) and is drawn at bar [i-1].
Bearish FVG
: The high of bar [i] is below the low of bar [i-2]. The gap zone spans from high[i] (bottom) to low[i-2] (top) and is drawn at bar [i-1]. Tapped vs. Filled
Once an imbalance is detected, the indicator continuously monitors whether subsequent price action interacts with the zone:
Tapped
: Price has entered the imbalance zone but has not fully traversed it. For a bullish FVG, this means price dropped into the gap from above but did not reach the bottom edge. The tapped portion is highlighted in a separate color.
Filled
: Price has completely crossed through the imbalance zone, reaching the opposite edge. The entire rectangle changes color to indicate the gap is no longer active.
This distinction is useful because a tapped-but-unfilled FVG often still acts as a support/resistance zone, while a fully filled FVG is considered consumed.
Input Parameters Indicator Buffers
The indicator exposes 7 buffers (no plots drawn; data only) that can be read by Expert Advisors or other indicators:
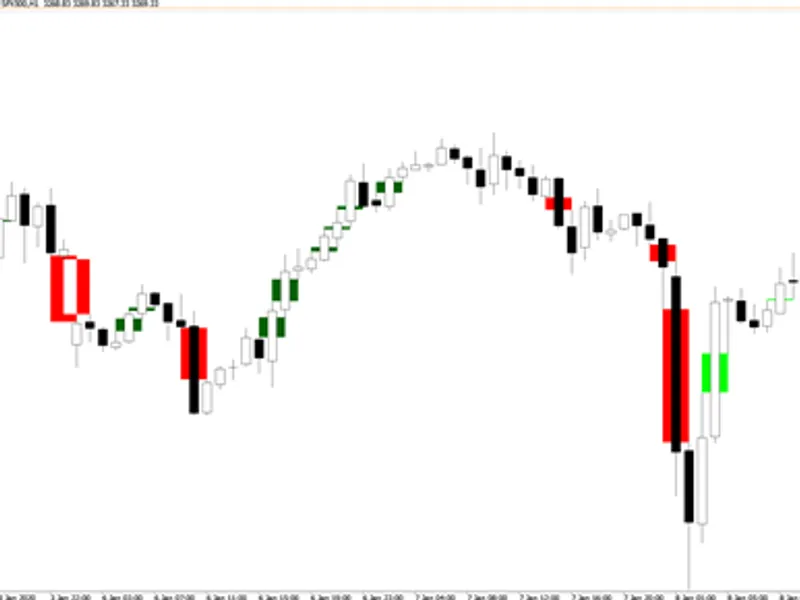
Reading the Chart
Active imbalances
appear as colored rectangles spanning three bars.
When price taps into a zone, a second rectangle in the tapped/filled color overlays the portion that was penetrated.
When price fills the entire zone, the original rectangle is replaced by a single rectangle in the filled color.
Set "Show Tapped / Filled Imbalances" to false if you only want to see active (untouched) FVGs. Notes
The indicator recalculates all imbalances and their status on first load (historical data). On subsequent bars, only the latest bar is checked for new imbalances, and all open imbalances are monitored against the current tick.
Object names are prefixed with ImbalanceUp- and ImbalanceDn- to avoid conflicts with other indicators or manual drawings.
Removing the indicator cleanly deletes only its own chart objects.