Standard Deviation (Std Dev)
This is a powerful addition to your MetaTrader 5 toolkit designed to optimize market analysis and performance. This technical indicator acts as a specialized analysis tool designed to visualize market data. It helps traders identify emerging trends, momentum shifts, and key support or resistance levels by plotting statistical calculations directly onto price charts.
How to Setup and Use Standard Deviation (Std Dev)
1. Installation: Place your file in the MQL/Indicators folder via "Open Data Folder" and restart your terminal.
2. Loading: Find the indicator in the Navigator, drag it onto your chart, and configure the input parameters in the popup window.
3. Customization: Press Ctrl+I to open the indicator list, select your tool, and click "Properties" to change colors, levels, or visual styles.
4. Updating: Replace the old file in the Indicators folder with the new version and restart the platform to apply changes.
Frequently Asked Questions
Q: Why is my indicator not showing? A: Verify the file is in the MQL/Indicators folder, or try right-clicking the "Indicators" tree in the Navigator and clicking "Refresh."
Q: Do custom indicators slow down the platform? A: Too many complex indicators can impact performance; remove unused ones via the "Indicator List" (Ctrl+I).
Q: Can I use MT4 indicators on MT5? A: No, MQL4 and MQL5 are distinct languages; ensure the indicator is compiled specifically for your platform version.
Description & Settings
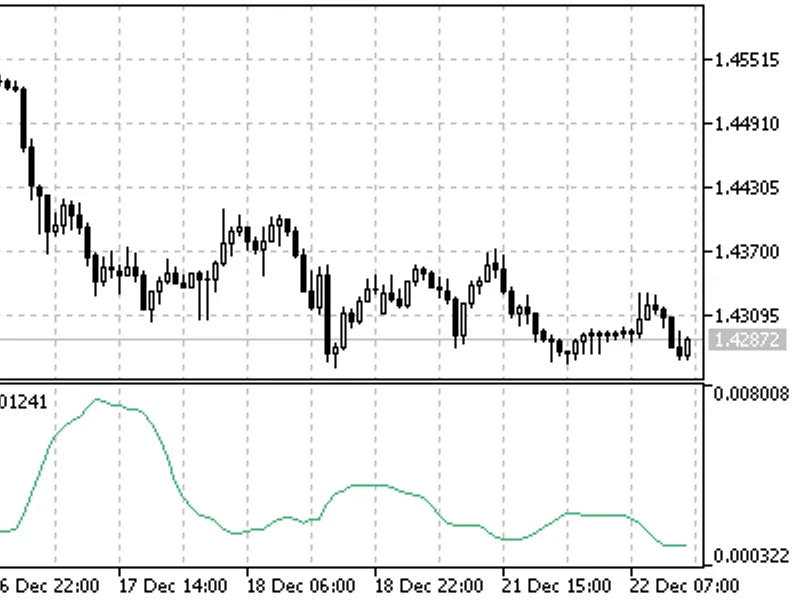
Technical indicator named Standard Deviation (StdDev) measures the market volatility.
This indicator charactrizes the scale of price changes relating to the Moving Average. Thus, if the indicator value is large, the market is volatile and the bars prices are rather dispersed relating to the moving average. If the indicator value is not large, it means that the market volatility is low and the bars prices are rather close to the moving average.
Normally, this indicator is used as a constituent of other indicators. Thus, when Bollinger Bands is calculated, the value of the symbol standard deviation is added to its Moving Average.
The market behavior represents the interchange of high trading activity and languid market. So, the indicator can be interpreted easily:
If its value is too low, i.e., the market is absolutely inactive, it makes sense to expect a spike soon;
Otherwise, if it is extremely high, it most probably means that activity will decline soon.
Calculation: StdDev (i) = SQRT (AMOUNT (j = i - N, i) / N)AMOUNT (j = i - N, i) = SUM ((ApPRICE (j) - MA (ApPRICE , N, i)) ^ 2)
where:
StdDev (i) - Standard Deviation of the current bar;
SQRT - square root;
AMOUNT(j = i - N, i) - sum of squares from j = i - N to i;
N - smoothing period;
ApPRICE (j) - the applied price of the j-th bar;
MA (ApPRICE (i), N, i) - any moving average of the current bar for N periods;
ApPRICE (i) - the applied price of the current bar.