DF-Profit Monitor
This professional-grade solution for MetaTrader 4 helps traders achieve greater efficiency in their daily workflow. This technical indicator acts as a specialized analysis tool designed to visualize market data. It helps traders identify emerging trends, momentum shifts, and key support or resistance levels by plotting statistical calculations directly onto price charts.
How to Setup and Use DF-Profit Monitor
1. Installation: Place your file in the MQL/Indicators folder via "Open Data Folder" and restart your terminal.
2. Loading: Find the indicator in the Navigator, drag it onto your chart, and configure the input parameters in the popup window.
3. Customization: Press Ctrl+I to open the indicator list, select your tool, and click "Properties" to change colors, levels, or visual styles.
4. Updating: Replace the old file in the Indicators folder with the new version and restart the platform to apply changes.
Frequently Asked Questions
Q: Why is my indicator not showing? A: Verify the file is in the MQL/Indicators folder, or try right-clicking the "Indicators" tree in the Navigator and clicking "Refresh."
Q: Do custom indicators slow down the platform? A: Too many complex indicators can impact performance; remove unused ones via the "Indicator List" (Ctrl+I).
Q: Can I use MT4 indicators on MT5? A: No, MQL4 and MQL5 are distinct languages; ensure the indicator is compiled specifically for your platform version.
Description & Settings
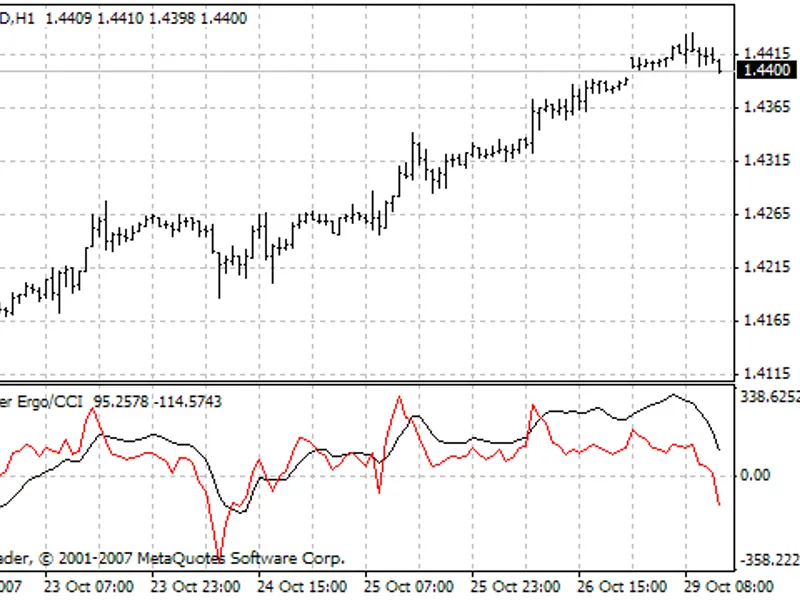
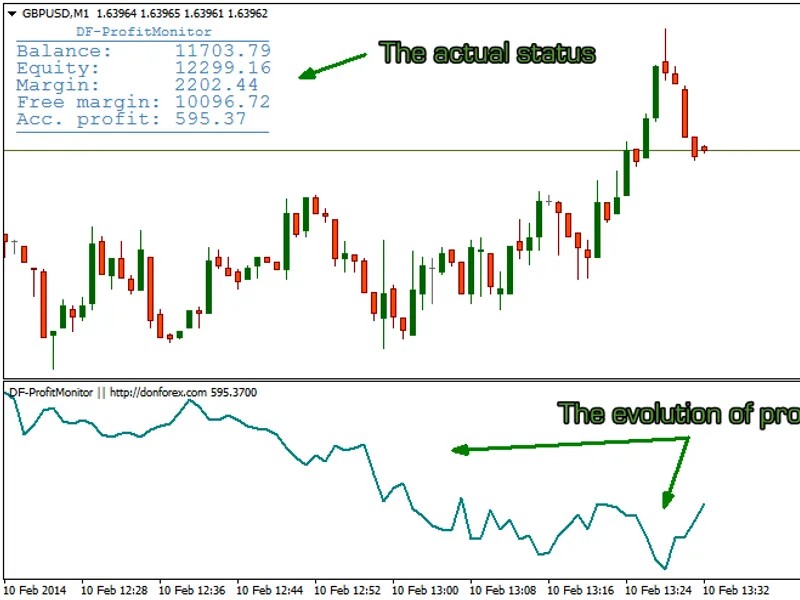
This is a very simple and very useful indicator to follow the evolution of profit.
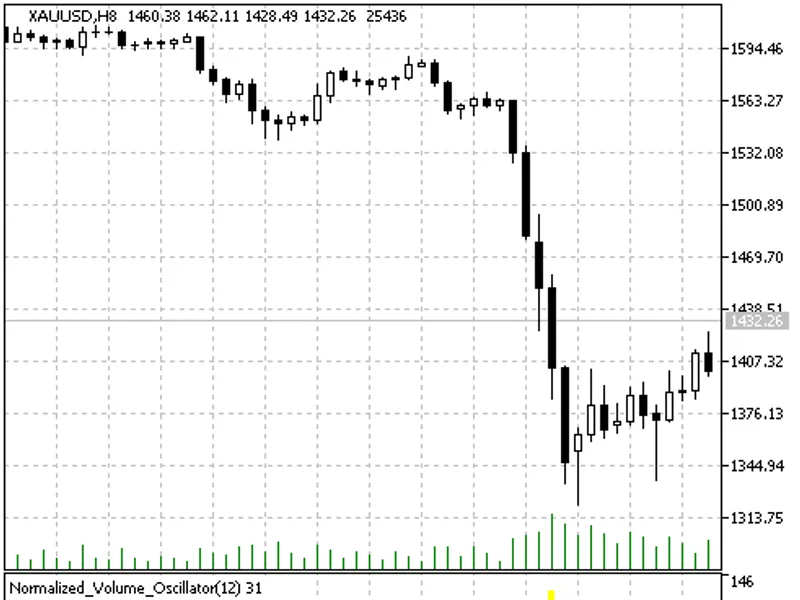
It displays the actual status of account in the main window and the profit curve in a subwindow.
There are two method for displaying:
1./
Total
profit of the account
2./ Profit selected by
magicnumber
Recommended: use it on
M1 timeframe
because of the more details
Note:
The first data will appear in the subwindow after closing of the actual candle. (Be patient, it will be within 1 minute on M1 timeframe.)
This indicator DOES NOT save data at all. It means, if you change indicator settings or timeframe, the curve will disappear and starts the drawing again