Ex Machina Heikin Ashi
This is a powerful addition to your MetaTrader 5 toolkit designed to optimize market analysis and performance. This technical indicator acts as a specialized analysis tool designed to visualize market data. It helps traders identify emerging trends, momentum shifts, and key support or resistance levels by plotting statistical calculations directly onto price charts.
How to Setup and Use Ex Machina Heikin Ashi
1. Installation: Place your file in the MQL/Indicators folder via "Open Data Folder" and restart your terminal.
2. Loading: Find the indicator in the Navigator, drag it onto your chart, and configure the input parameters in the popup window.
3. Customization: Press Ctrl+I to open the indicator list, select your tool, and click "Properties" to change colors, levels, or visual styles.
4. Updating: Replace the old file in the Indicators folder with the new version and restart the platform to apply changes.
Frequently Asked Questions
Q: Why is my indicator not showing? A: Verify the file is in the MQL/Indicators folder, or try right-clicking the "Indicators" tree in the Navigator and clicking "Refresh."
Q: Do custom indicators slow down the platform? A: Too many complex indicators can impact performance; remove unused ones via the "Indicator List" (Ctrl+I).
Q: Can I use MT4 indicators on MT5? A: No, MQL4 and MQL5 are distinct languages; ensure the indicator is compiled specifically for your platform version.
Description & Settings
ExMachina Heikin Ashi Enhanced v3.0
— part of the ExMachina Trading Systems free Code Base collection. The most feature-complete free Heikin Ashi indicator on the MQL5 Code Base.
Features
Two draw modes
: color-coded HA candles (OHLC with proper High/Low) or smoothed color line overlay
Five smoothing methods
: SMA, EMA, Double-Smoothed EMA (Vervoort-style DEMA), SMMA, and LWMA — all with configurable period
Step filter
: noise reduction in pips — ignores HA changes smaller than a configurable threshold (like mladen’s, but on top of 5 smoothing methods)
Signal arrows
: Wingdings arrows (▲/▼) plotted on chart at every color change — configurable arrow codes and offset
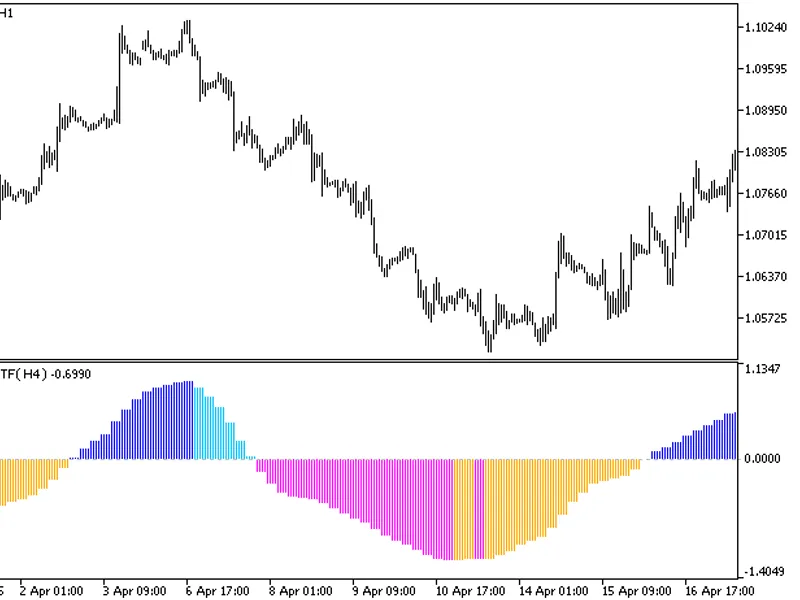
Multi-Timeframe (MTF)
: display higher-timeframe HA data mapped onto current chart
Full HA calculation
: proper recursive HA Open, High, Low, Close
Consecutive bar counter
: tracks streak of same-color bars in real time
Strength meter
: body-to-range ratio with visual bar (████░░░░░░) and percentage
HA Delta
: shows Close − Open difference with signed color
Dashboard panel
: 9 data rows — Trend, Smoothing, Step Filter, HA Close, HA Open, HA Delta, Consecutive, Strength %, Strength Bar
Fully customizable
: 8 input groups, 30+ inputs — colors, dashboard position/fonts, arrow codes, everything configurable
Clean chart management
: all objects use the EXHA_ prefix for safe removal Architecture
14 buffers (3 plots + 5 calculation buffers)
DEMA uses dedicated dual-buffer approach (no fragile static variables)
Modular: CalcStandard / CalcMTF / ApplySmoothing / ApplyStepFilter / AssignBar
829 lines, zero external dependencies Input Groups
General: draw mode, MTF timeframe
Smoothing: method (None/SMA/EMA/DEMA/SMMA/LWMA), period
Step Filter: threshold in pips
Signal Arrows: on/off, bull/bear arrow codes, offset
Colors: bull, bear, neutral
Dashboard: position, font size, 4 color inputs
Works on all symbols and all timeframes. No repaint on closed bars.
Developed by
ExMachina Trading Systems
— Precision before profit.
For professional trading tools, visit:
Tags (comma-separated) Category
Technical Indicators
Subcategory
Trend Indicators