Сode that records balance and equity charts and calculates additional optimization criteria
This is a powerful addition to your MetaTrader 5 toolkit designed to optimize market analysis and performance. This library provides a collection of modular, reusable code. It is utilized by developers to organize common functions, allowing for the integration of complex logic across multiple Expert Advisors, indicators, or scripts without the need for code duplication.
How to Setup and Use Сode that records balance and equity charts and calculates additional optimization criteria
1. Storage: Place library files in the MQL/Libraries directory to ensure they are accessible to your projects.
2. Implementation: Include the library in your code using the #import directive, ensuring you match the exact function names and parameters.
3. Compilation: Ensure the library is present in the directory before you compile your main EA or script, as the compiler links them during this phase.
4. Management: Keep libraries organized in sub-folders if you manage many custom functions to maintain a clean project structure.
Frequently Asked Questions
Q: What is a library file used for? A: Libraries store reusable code modules, allowing you to centralize common logic used by multiple EAs or indicators.
Q: Is a library executable? A: No, libraries are non-executable files containing functions; they must be imported into an EA, indicator, or script to function.
Q: Can I update a library while the platform is running? A: You should compile your EA or script after updating a library to ensure the latest code changes are integrated.
Description & Settings
I decided to share the code from a large project designed in a separate library.
If you have access to the Expert Advisor code, you can save balance and equity charts and calculate additional optimization criteria by adding additional code from this library.Download the
Advanced Optimization Report Saver.mqh
file from attached link and save it to the terminal folder
\MQL5\Include\
Add the code that connects the downloaded file: (you can add it below the last line of your Expert Advisor code or anywhere else)
Then, you need to add calls to the exported functions to the existing functions in your Expert Advisor: (if there are no functions, add them)
save_Add functions, allow you to add your own criteria that you want to include to yourReport:
For example, let's add this code to the
Moving Average
Expert Advisor from the
Examples
folder (...\MQL5\Experts\Examples\Moving Average\
Moving Average.mq5
). First, copy the original Expert Advisor and name it
Moving Average Charts.mq5
. Now, add the code from the instructions above to it.The changes are only at the very end of the code, starting from the OnTick() function after
CheckForOpen()
; line:
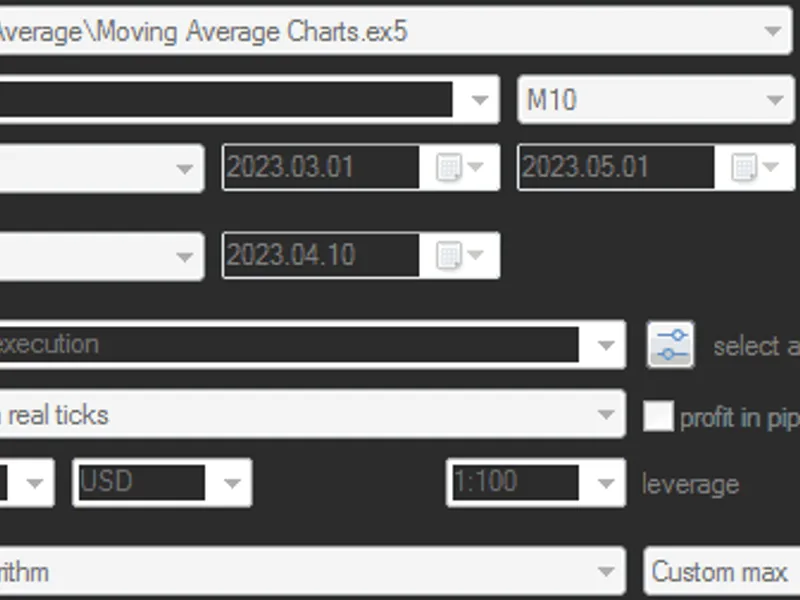
As you can see, it's quite simple and only takes a couple of minutes.After that, you can run the optimization:
The last screenshot shows that the connected code added 2 parameters:
Save Statistics
- enables or disables the collection of statistics
Pixels in balance and equity charts
- specifies the number of pixels in the width of mini-charts.
Once the optimization is complete, you can create a report (using a program that parses saved frames) and see the following:
If there are more than 20 lines, only 3 horizontal lines of average values will be displayed: 3 on top and 3 on the bottom.100 lines are difficult to perceive, so you need to reduce their number.You to use input variables not with the same step, but with a scale through an enumerator (enum), for example: 1,2,3,5,7,10,15,20,30,50,70,100 - there will be only 12 lines instead of 100.
You can download the
enum version
of the Expert Advisor from attached files.Instead of 1000 optimization passes, there will be 120, and the calculation time will be ~8 times faster, and the file size will be ~8 times smaller.The result is more visible:
The result with MovingPeriod = 15 stands out immediately, with the highest average line and the highest maximum.However, as is often the case, the best results on the backtest are not the best on the forward test.Your program that parses saved frames can display Charts like this:
And additional criteria like this:
If you have a code for other interesting criteria, you can suggest them for adding to the library.