Advanced MT F RS I
This software component for MetaTrader 4 is built to enhance the capabilities of your trading environment. This technical indicator acts as a specialized analysis tool designed to visualize market data. It helps traders identify emerging trends, momentum shifts, and key support or resistance levels by plotting statistical calculations directly onto price charts.
How to Setup and Use Advanced MT F RS I
1. Installation: Place your file in the MQL/Indicators folder via "Open Data Folder" and restart your terminal.
2. Loading: Find the indicator in the Navigator, drag it onto your chart, and configure the input parameters in the popup window.
3. Customization: Press Ctrl+I to open the indicator list, select your tool, and click "Properties" to change colors, levels, or visual styles.
4. Updating: Replace the old file in the Indicators folder with the new version and restart the platform to apply changes.
Frequently Asked Questions
Q: Why is my indicator not showing? A: Verify the file is in the MQL/Indicators folder, or try right-clicking the "Indicators" tree in the Navigator and clicking "Refresh."
Q: Do custom indicators slow down the platform? A: Too many complex indicators can impact performance; remove unused ones via the "Indicator List" (Ctrl+I).
Q: Can I use MT4 indicators on MT5? A: No, MQL4 and MQL5 are distinct languages; ensure the indicator is compiled specifically for your platform version.
Description & Settings
With the MTF RSI Indicator you can easily identify the oversold/overbought levels on several different timeframes by using only one chart. Short Term trades can be confirmed by higher timeframe RSI Levels.
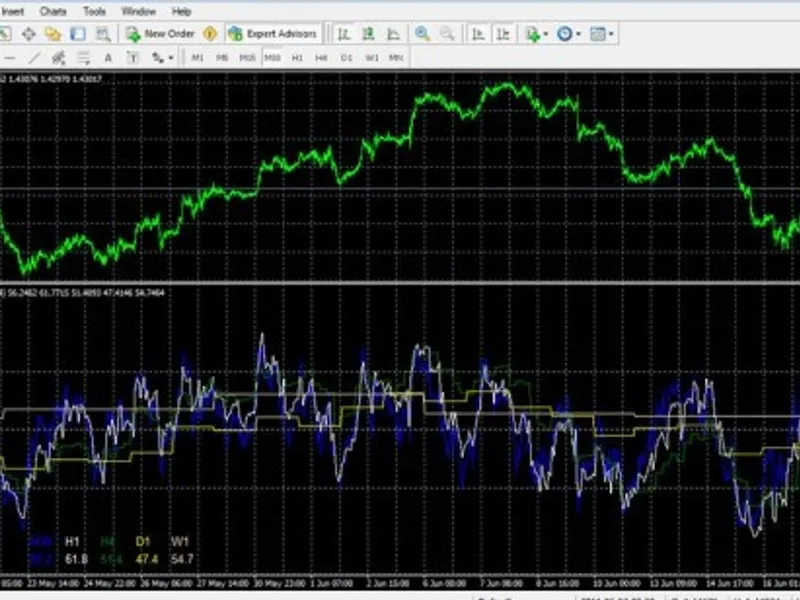
MTF RSI in Action
The built in Automatic Timeframe Recognition ensures that you don't have to struggle with the reading of unnecessary information in the RSI indicator window. When you change the timeframe of your chart, the indicator will automatically adjust the displayed RSI values, and values from lower timeframes than your current chart won't be displayed and calculated anymore therefore the program is using less computing resources.
professionally coded
automatic timeframe recognition
works with any broker and on any currency
leading trading signals
easy readability
This indicator can be fully customized to your needs and to fit with any of your setups.
RSI Period:
Set the period for the RSI calculation as usual.
Available Timeframes:
M1 - 1 Minute
M5 - 5 Minutes
M15 - 15 Minutes
M30 - 30 Minutes
H1 - 1 Hour
H4 - 4 Hours
D1 - Daily
W1 - Weekly
RSI Price:
Set the price constant for the RSI calculation as usual:
0 = Close price.
1 = Open price.
2 = High price.
3 = Low price.
4 = Median price, (high+low)/2.
5 = Typical price, (high+low+close)/3.
6 = Weighted close price, (high+low+close+close)/4
SCREENSHOTS