i Stochastic Of Osc
This software component for MetaTrader 5 is built to enhance the capabilities of your trading environment. This technical indicator acts as a specialized analysis tool designed to visualize market data. It helps traders identify emerging trends, momentum shifts, and key support or resistance levels by plotting statistical calculations directly onto price charts.
How to Setup and Use i Stochastic Of Osc
1. Installation: Place your file in the MQL/Indicators folder via "Open Data Folder" and restart your terminal.
2. Loading: Find the indicator in the Navigator, drag it onto your chart, and configure the input parameters in the popup window.
3. Customization: Press Ctrl+I to open the indicator list, select your tool, and click "Properties" to change colors, levels, or visual styles.
4. Updating: Replace the old file in the Indicators folder with the new version and restart the platform to apply changes.
Frequently Asked Questions
Q: Why is my indicator not showing? A: Verify the file is in the MQL/Indicators folder, or try right-clicking the "Indicators" tree in the Navigator and clicking "Refresh."
Q: Do custom indicators slow down the platform? A: Too many complex indicators can impact performance; remove unused ones via the "Indicator List" (Ctrl+I).
Q: Can I use MT4 indicators on MT5? A: No, MQL4 and MQL5 are distinct languages; ensure the indicator is compiled specifically for your platform version.
Description & Settings
The Stochastic of all oscillator-like indicators, included in MetaTrader 5 client terminal.
Parameters:
Indicator
- type of the indicator;
Volume
- volume type;
Period_1
- 1st period;
Period_2
- 2nd period;
Period_3
- 3rd period;
Price
- applied price type;
Method
- smoothing method;
Shift_1
- shift 1;
Shift_2
- shift 2;
Shift_3
- shift 3;
Line
- selected line of the indicator;
StPeriod_K
- Stochastic К period;
StPeriod_D
- Stochastic D period;
StPeriod_S
- Stochastic S period;
StMethod
- Smoothing method for the signal line.
Parameters, used for the each indicator:
AD
: Volume;
ADX
: Period_1;
ADXW
: Period_1;
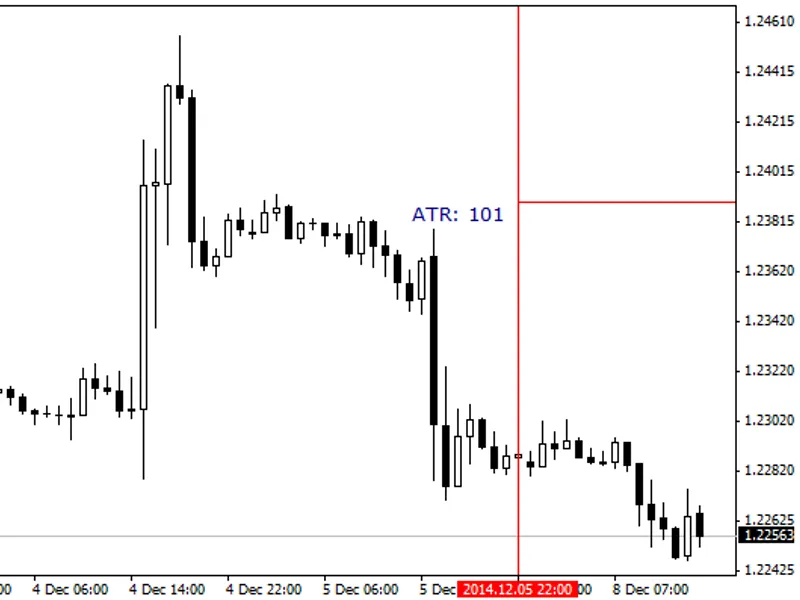
ATR
: Period_1;
BEARS
: Period_1;
BULLS
: Period_1;
BWMFI
: Volume;
CCI
: Period_1, Price;
CHAIKIN
: Period_1 (Fast), Period_2 (Slow), Method, Volume;
DEMARKER
: Period_1;
FORCE
: Period_1, Method, Volume;
GATOR
: Period_1, Shift_1 (Jaw), Period_2, Shift_2 (Teeth), Period_3, Shift_3 (Lips), Method, Price;
MACD
: Period_1 (Fast), Period_2 (Slow), Period_3 (Signal), Price;
MFI
: Period_1, Volume;
MOMENTUM
: Period_1, Price;
OBV
: Volume;
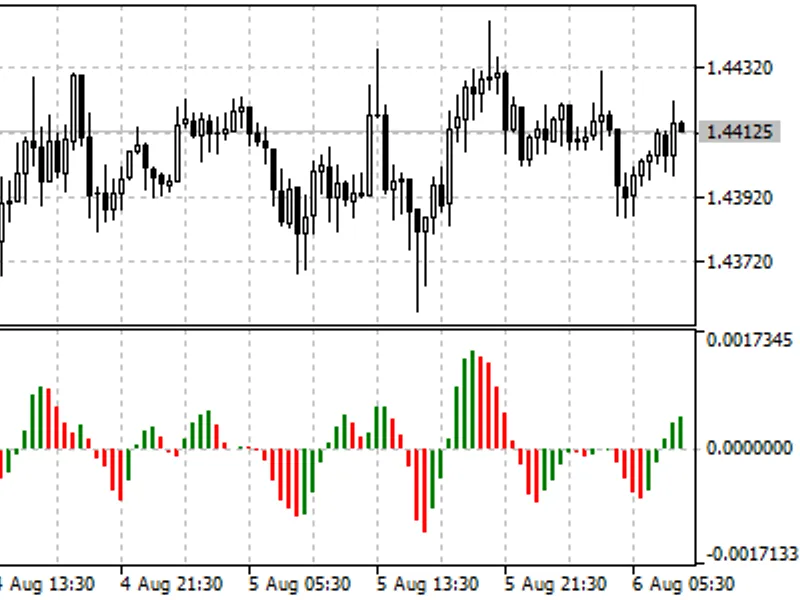
OSMA
: Period_1 (Fast), Period_2 (Slow), Period_3 (Signal), Price;
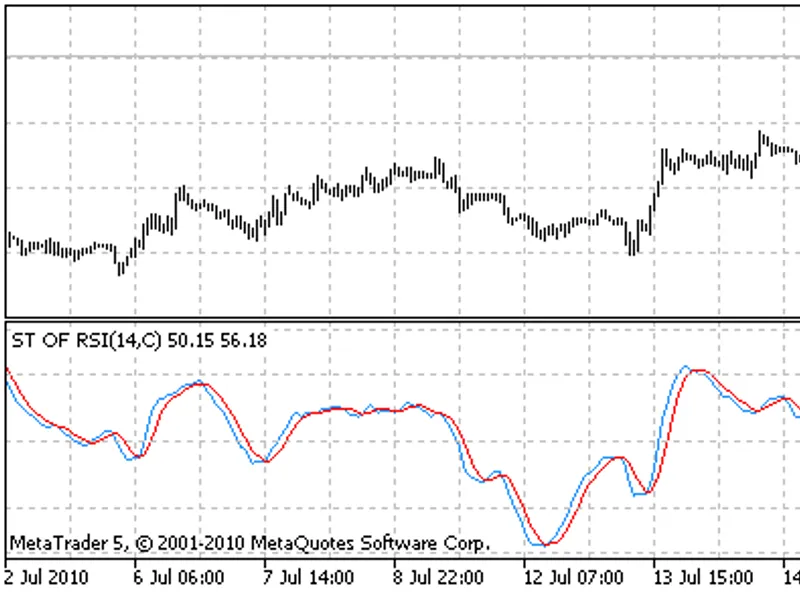
RSI
: Period_1, Price;
RVI
: Period_1;
STDDEV
: Period_1, Method, Price;
STOCHASTIC
: Period_1 (K), Period_2 (D), Period_3 (S), Method, Price;
TRIX
: Period_1, Price;
VOLUMES
: Volume;
WPR
: Period_1.
Note.
The Line parameter may be one of the following:
For STOCHASTIC and MACD
: MAIN and SIGNAL.
For ADX and ADXW
: ADX_ADX, ADX_PDI and ADX_MDI.
For GATOR
: GATOR_UPPER_HISTOGRAM and GATOR_LOWER_HISTOGRAM.
For other indicators
: MAIN.
Because of the fact, that some of the different Line identifiers have the same values, after the change of the Line value and opending the indicator properties window, you may see the different Line value. It's not an error, the other identifier can be plotted, but with the same value, as has been selected before. The different identifiers with same values are used for the convience.The same for the Price parameter - the CLOSECLOSE and LOWHIGH are added for the Stochastic, the standard values for the other indicators.