Awesome Mod Pips
This tool for MetaTrader 5 is specifically engineered to streamline your trading operations. This technical indicator acts as a specialized analysis tool designed to visualize market data. It helps traders identify emerging trends, momentum shifts, and key support or resistance levels by plotting statistical calculations directly onto price charts.
How to Setup and Use Awesome Mod Pips
1. Installation: Place your file in the MQL/Indicators folder via "Open Data Folder" and restart your terminal.
2. Loading: Find the indicator in the Navigator, drag it onto your chart, and configure the input parameters in the popup window.
3. Customization: Press Ctrl+I to open the indicator list, select your tool, and click "Properties" to change colors, levels, or visual styles.
4. Updating: Replace the old file in the Indicators folder with the new version and restart the platform to apply changes.
Frequently Asked Questions
Q: Why is my indicator not showing? A: Verify the file is in the MQL/Indicators folder, or try right-clicking the "Indicators" tree in the Navigator and clicking "Refresh."
Q: Do custom indicators slow down the platform? A: Too many complex indicators can impact performance; remove unused ones via the "Indicator List" (Ctrl+I).
Q: Can I use MT4 indicators on MT5? A: No, MQL4 and MQL5 are distinct languages; ensure the indicator is compiled specifically for your platform version.
Description & Settings
This indicator is a modification of classical indicator. It computes the smoothed difference of two exponential moving averages.
The indicator has 3 inputs: shortmean and longmean stand for the periods of two exponential moving averages (by default 30 and 60, respectively). The last input, meanAO, indicate the period of the smoothed moving average for the difference (in pips) between the shortmean-longmean EMA's.
The code has essentially three buffers:
ExtFastBuffer is the exponential moving average with period shortmean;
ExtSlowBuffer is the exponential moving average with period longmean;
ExtAOBuffer defined as
Finally, using the "include <MovingAverages.mqh>", we compute the smoothed moving average of this last array (ExtAOBuffer) obtaning the indicator.
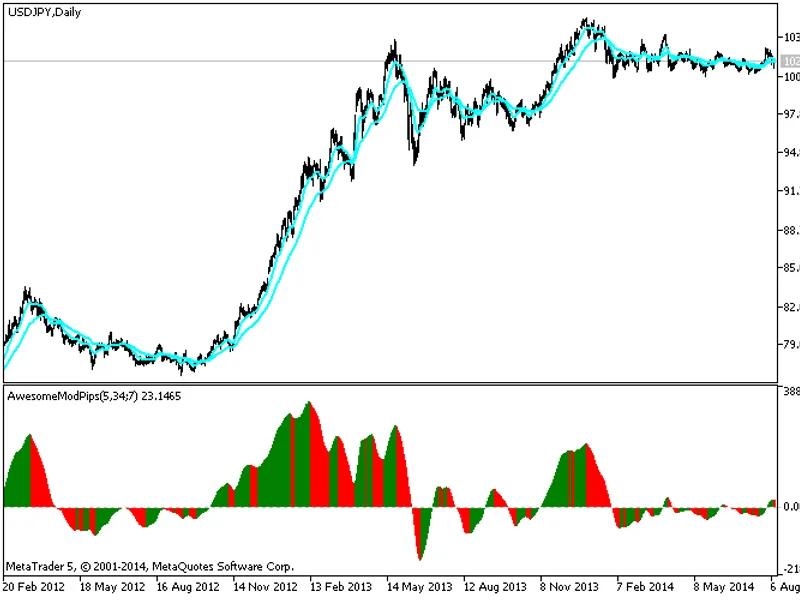
In the following image you can show this indicator in a daily chart of USDJPY with inputs 5 and 34 for the exponential means and 7 for the mean of the difference between them.
You can compare the indicator with the classical Awesome indicator which has as inputs for the exponential averages 5 and 34 in the following image.
Here, you can show an image with the parameters by default (30-60-30):