Commodity Channel Index (CC I)
This is a powerful addition to your MetaTrader 5 toolkit designed to optimize market analysis and performance. This technical indicator acts as a specialized analysis tool designed to visualize market data. It helps traders identify emerging trends, momentum shifts, and key support or resistance levels by plotting statistical calculations directly onto price charts.
How to Setup and Use Commodity Channel Index (CC I)
1. Installation: Place your file in the MQL/Indicators folder via "Open Data Folder" and restart your terminal.
2. Loading: Find the indicator in the Navigator, drag it onto your chart, and configure the input parameters in the popup window.
3. Customization: Press Ctrl+I to open the indicator list, select your tool, and click "Properties" to change colors, levels, or visual styles.
4. Updating: Replace the old file in the Indicators folder with the new version and restart the platform to apply changes.
Frequently Asked Questions
Q: Why is my indicator not showing? A: Verify the file is in the MQL/Indicators folder, or try right-clicking the "Indicators" tree in the Navigator and clicking "Refresh."
Q: Do custom indicators slow down the platform? A: Too many complex indicators can impact performance; remove unused ones via the "Indicator List" (Ctrl+I).
Q: Can I use MT4 indicators on MT5? A: No, MQL4 and MQL5 are distinct languages; ensure the indicator is compiled specifically for your platform version.
Description & Settings
Commodity Channel Index technical indicator (CCI) measures the deviation of the commodity price from its average statistical price.
High values of the index point out that the price is unusually high being compared with the average one, and low values show that the price is too low. In spite of its name, the Commodity Channel Index can be applied for any financial instrument, and not only for the commodities.
There are two basic techniques of using Commodity Channel Index:
Finding the divergences
. The divergence appears when the price reaches a new maximum, and Commodity Channel Index can not grow above the previous maximums. This classical divergence is normally followed by the price correction.
As an indicator of overbought/oversold states of the market
. Commodity Channel Index usually varies in the range of ±100. Values above +100 inform about overbought state (and about a probability of correction), and the values below 100 indicates the oversold state (and about a probability of price increase).
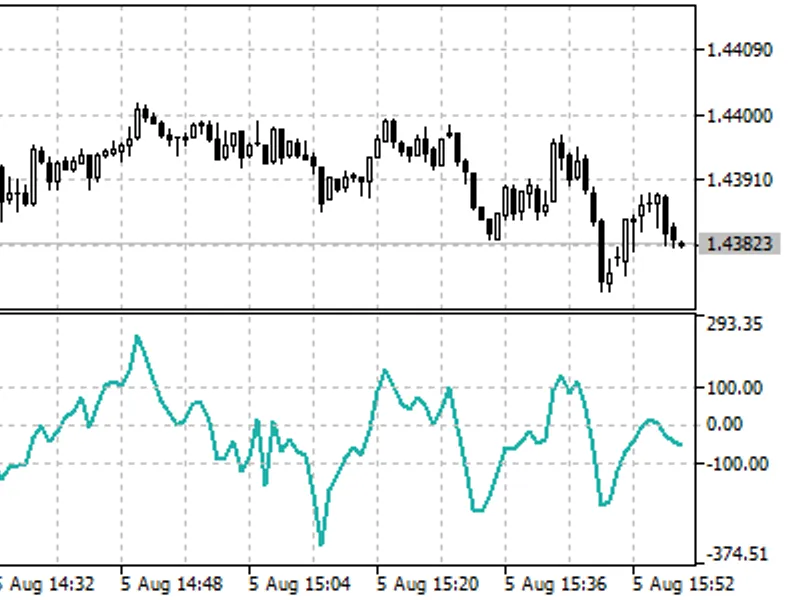
Commodity Channel Index indicator
Calculation:
1. To find a Typical Price. You need to add the HIGH, the LOW, and the CLOSE prices of each bar and then divide the result by 3:
TP = (HIGH + LOW + CLOSE) / 3
2. To calculate the n-period Simple Moving Average of Typical Prices:
SMA (TP, N) = SUM (TP, N) / N
3. To subtract the received SMA(TP, N) from Typical Prices of each of preceding n periods:
D = TP - SMA (TP, N)
4.To calculate the n-period Simple Moving Average of absolute D values:
SMA (D, N) = SUM (D, N) / N
5. To multiply the received SMA(D, N) by 0,015:
M = SMA (D, N) * 0,015
6. To divide M by D:
CCI = M / D
where:
HIGH - maximum bar price;
LOW - minimum bar price;
CLOSE - close price;
SMA - Simple Moving Average;
SUM - sum;
N - number of periods used for calculation.