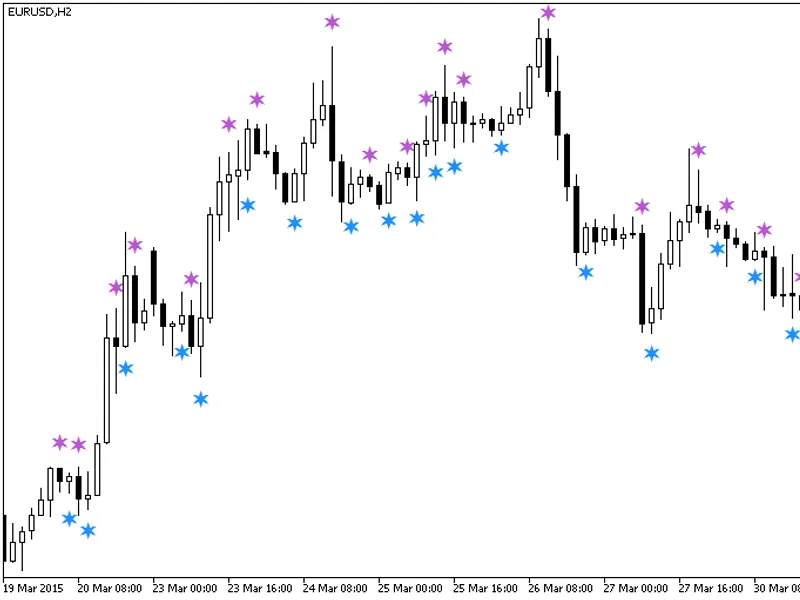
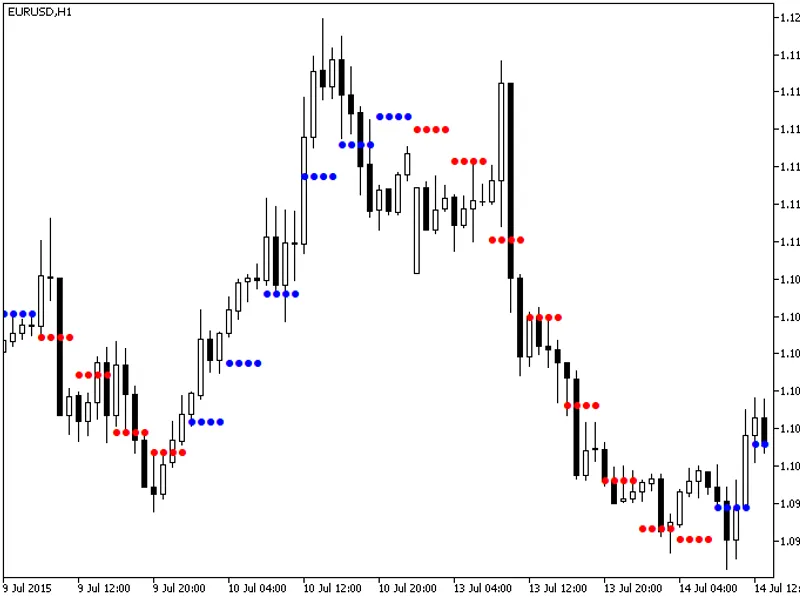
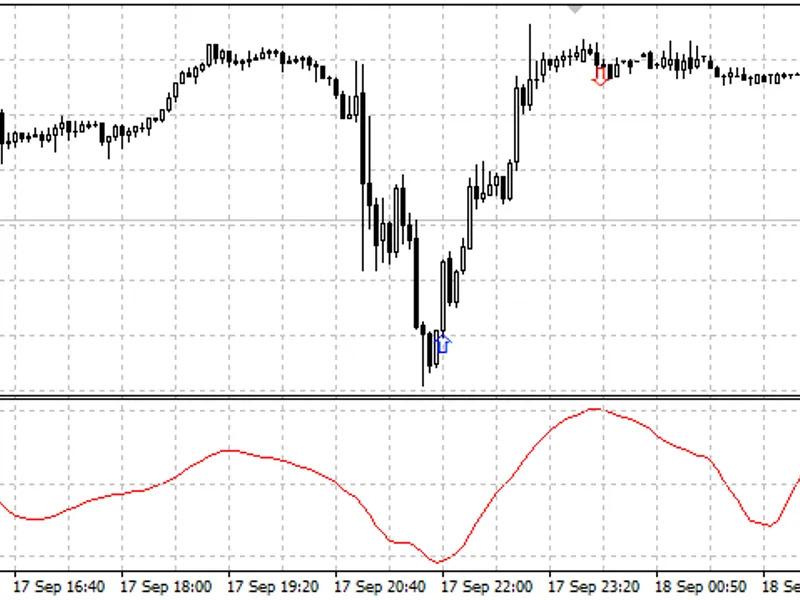
A semaphore signal indicator utilizing two indicators, calculated from the open and close values of the price series. Signals are generated when the difference between these indica...
This indicator displays a sequence of candlesticks, each representing a processed price time series using the FATLSATLOSMA algorithm. This visualization can provide valuable insigh...
A semaphore signal indicator utilizing two indicators based on open and close values of the price series. Signals are generated when the difference between these indicators changes...
A semaphore signal indicator utilizing two indicators based on open and close values of the price series. Signals are generated when the difference between these indicators changes...
A semaphore signal indicator that utilizes two OSMA (Oscillator Moving Average) indicators, based on the open and close values of the price series.Signals are generated when the di...
A semaphore signal indicator utilizing two CCI indicators based on the open and close values of the price series.Signals are generated when the difference between these indicators ...
A semaphore signal indicator that utilizes two momentum indicators, calculated from the open and close values of the price series.Signals are generated when the difference between ...
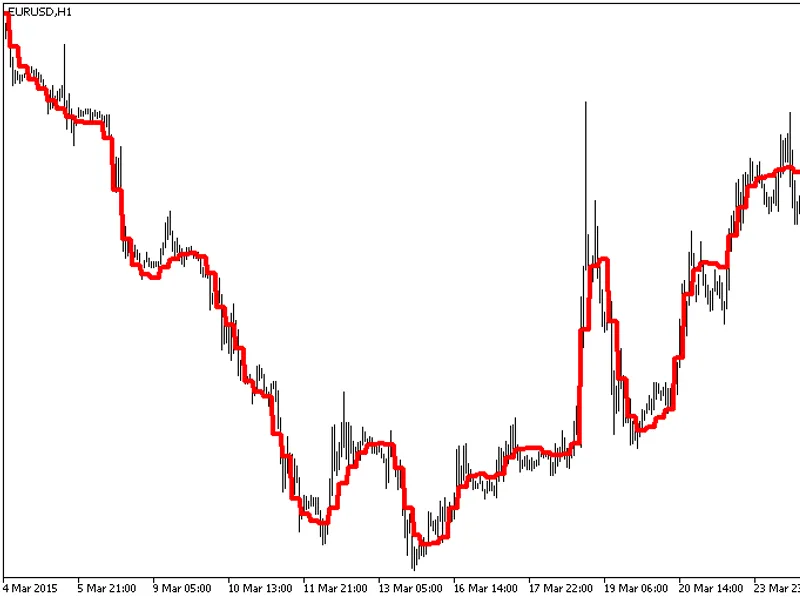
JMA HTF Indicator with Timeframe SelectionThis indicator features a timeframe selection option within its input parameters.To use this indicator, you will need the jma.mq5 indicato...
The indicator is implemented as a sequence of candlesticks.
Candlesticks appear as a result of relevant price timeseries processed by the JMA algorithm.
In many situations, this ap...
Adaptive Moving Average with Enhanced Trend Strength Indication using Colored Dots based on the Standard Deviation Algorithm.When the standard deviation of the JMA indicator falls ...
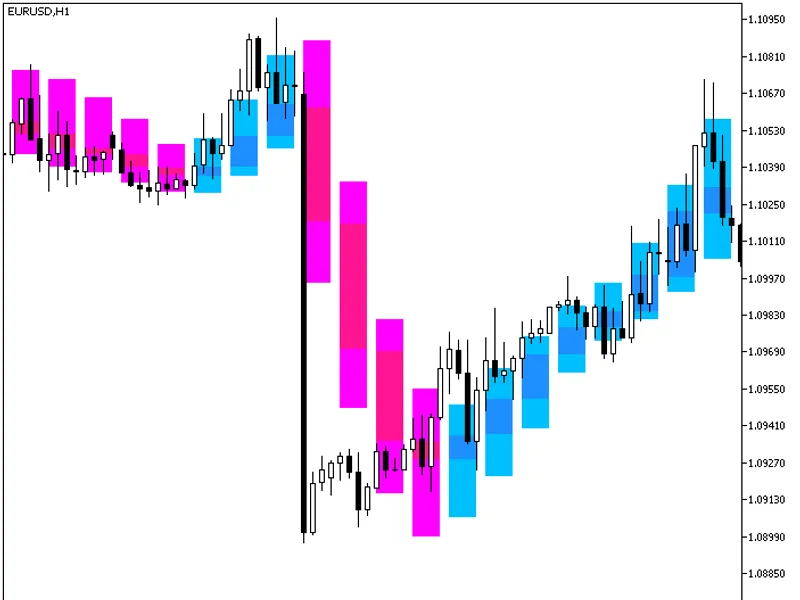
This indicator displays higher timeframe candlesticks as colored, filled rectangles using buffers.The body of the candlestick is colored blue or red depending on its direction, whi...
A standard Williams' Percent Range (WPR) indicator with the flexibility to choose between close, high, or low price types for its calculation.This indicator was originally develope...
WP R3 IndicatorThe WP R3 indicator displays three Williams' Percent Range (WPR) oscillators from the same timeframe, utilizing the close, high, and low prices within a single windo...
WPR Candle IndicatorThis indicator implements the Williams' Percent Range (WPR) as a sequence of candlesticks. The candlesticks are generated by processing the relevant price time ...
The MFI Candle indicator displays trading signals as a sequence of candlesticks.These candlesticks are generated by applying the Money Flow Index (MFI) algorithm to the price time ...
FP HTF Indicator
This indicator includes a timeframe selection option within its input parameters.
The indicator requires the FP.mq5 indicator file. Please place this file in the...
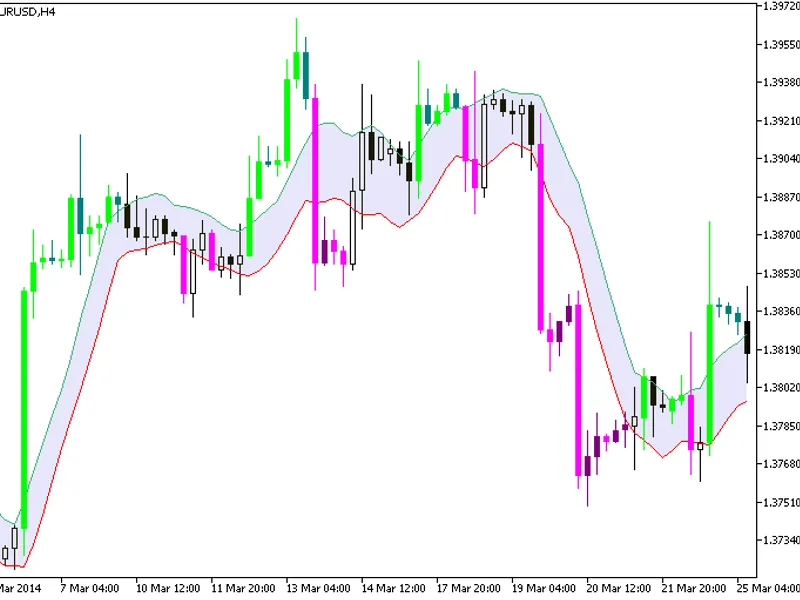
The XMA Range Channel indicator displays a channel formed by two moving averages applied to the high and low price series. It utilizes smoothing algorithms from the
.mqh library. C...
GeTrendOsc HTF Indicator
This indicator includes a timeframe selection option available in the input parameters.
The indicator requires the getrendosc.mq5 indicator file. Please ...
A semaphore signal indicator utilizing two JMA (Jorgensen Moving Average) indicators, based on the open and close values of the price series. Signals are generated when the differe...
An indicator designed to calculate a secure stop loss level for open trading positions.The indicator utilizes classes from the smoothalgorithms.mqh library. Ensure you copy this li...
Asymmetry HTF Indicator
This indicator includes a timeframe selection option within its input parameters.
To use this indicator, you need the asymmetry.mq5 indicator file. Please...
This indicator offers a timeframe selection option directly within its input parameters.It requires the vinini_bb.mq5 indicator file. Please ensure this file is placed in the \mql5...
WPR HTF Indicator with Timeframe SelectionThis indicator includes a timeframe selection option within its input parameters.Prerequisites:The WPR HTF indicator requires the wpr.mq5 ...
Sum of three moving averages of different timeframes in a separate window.The indicator uses the smoothalgorithms.mqh library classes. Ensure this library is present in your termin...
The Ultra Oscillator HTF indicator offers a unique feature: the ability to select the timeframe directly from the input parameters.This indicator requires the ultra_oscillator.mq5 ...
The indicator with the timeframe selection option available in the input parameters.The indicator requires the XMA_Range_Channel.mq5 indicator file. Place it in <terminal_data_f...
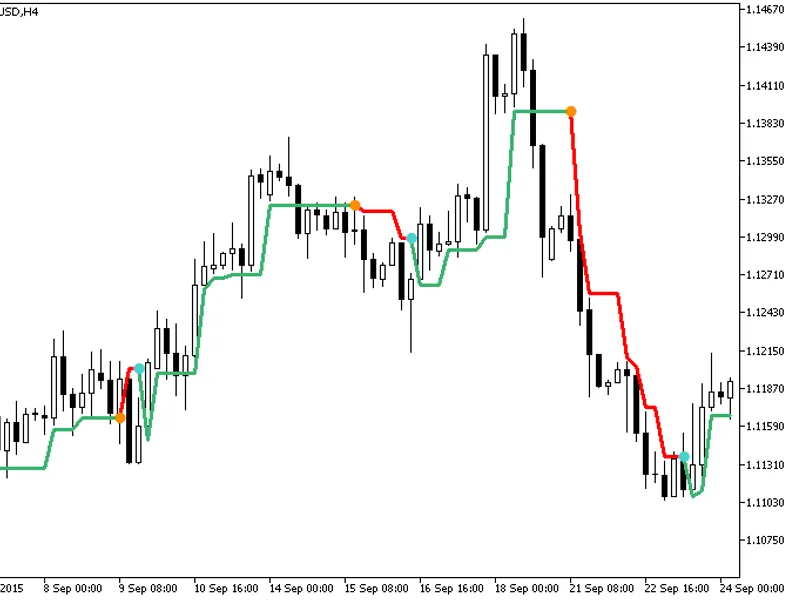
Indicators that provide simple and clear indications are popular on the forex market. The Super Trend indicator is one such tool that displays its values directly on the price char...
The Super Trend HTF indicator offers a unique feature: the ability to select the timeframe directly from the input parameters.To use this indicator, you'll need the super_trend.mq5...
The Dots Indicator is a powerful tool for trend analysis, inspired by the work of TrendLaboratory. It provides a visual representation of the current trend direction by displaying ...
The Dots HTF indicator offers a unique feature: the ability to select the timeframe directly from the input parameters.This indicator relies on the dots.mq5 file, which should be p...
The Dots Candle indicator is a unique visualization tool that transforms price data into a sequence of candlesticks.This indicator processes relevant price time series through a sp...
This indicator draws candlesticks from a higher timeframe as colored filled rectangles using buffers. The body of the candlestick is painted blue or red depending on its direction,...
Linear Momentum IndicatorA variant of the momentum indicator that incorporates volume and time into its calculations.The indicator utilizes the smoothalgorithms.mqh library classes...
Fractal Dimension HTF Indicator with Timeframe SelectionThis indicator includes a timeframe selection option within its input parameters.The indicator requires the fractal_dimensio...
A simple oscillator that shows the speed of the MACD indicator change, implemented as a two-colored histogram.
The indicator uses the SmoothAlgorithms.mqh library classes. Ensure ...
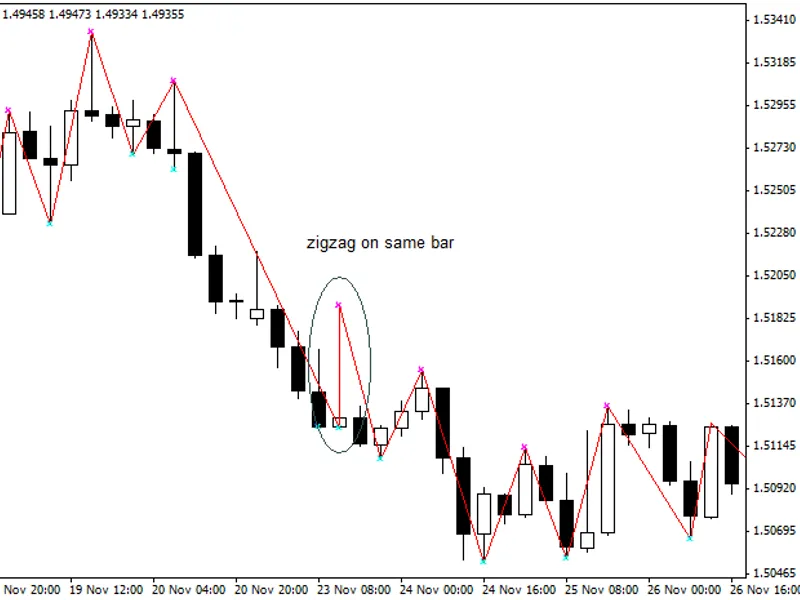
This Zig Zag indicator utilizes dual buffers to store high and low points. A point is identified as a new high or low if its value surpasses the high or low of the preceding 'n' ba...
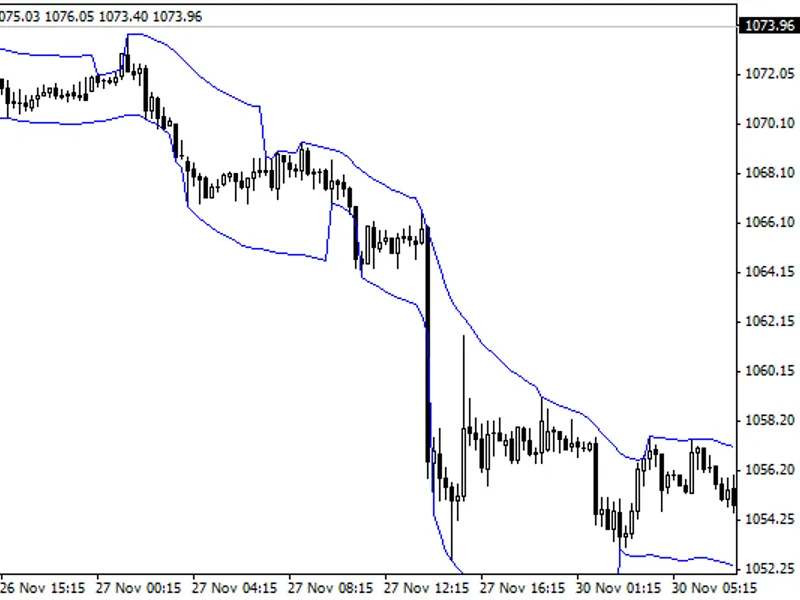
This indicator draws a channel based on the maximum and minimum values over a specified period, incorporating a slope calculation.Features:- Implements a Donchian Channel.- Include...
This indicator automatically downloads historical data for symbols that have open charts.This eliminates the need to wait for data updates when switching between timeframes.The ind...
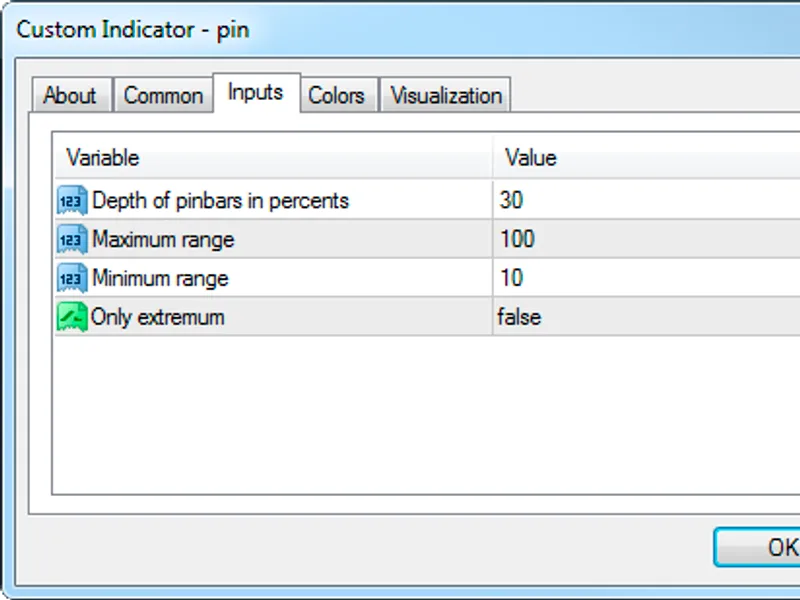
This indicator identifies pin bars on the chart according to user-defined parameters.The adjustable parameters include:- Maximum bar size- Minimum bar size- Pin bar depth (percenta...
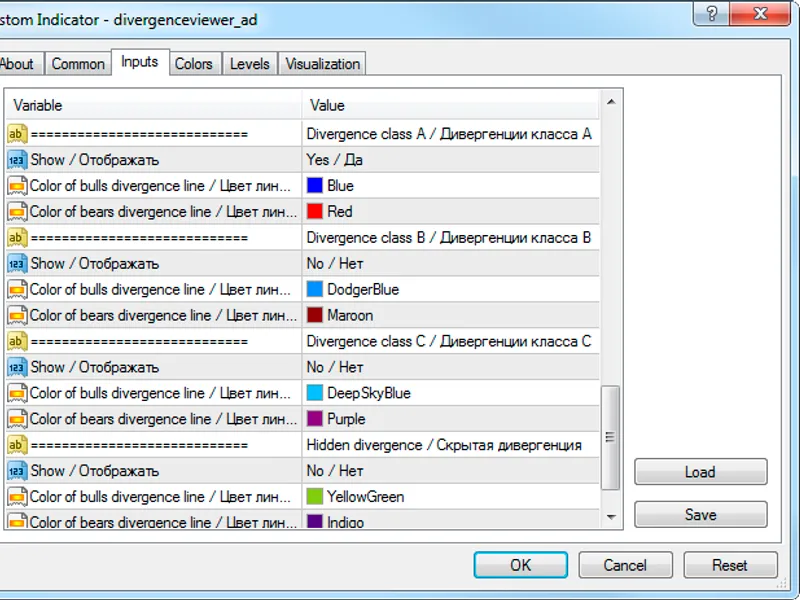
This indicator visually displays divergences using two matched lines: one on the price chart and another on the indicator chart.It supports the detection of four types of divergenc...
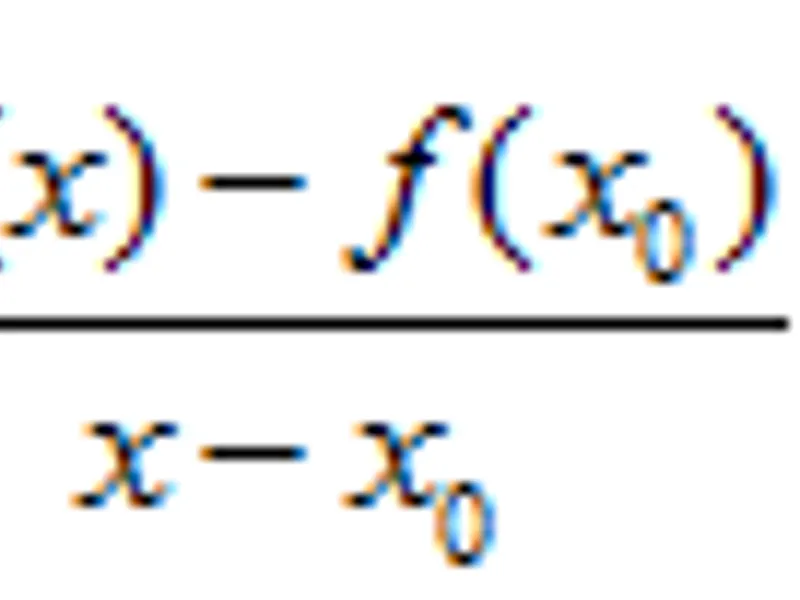
In mathematics, the value of the derivative is calculated according to the following simple formula:(1)where:x0 — current value of the argument,x — value of the argument to the...
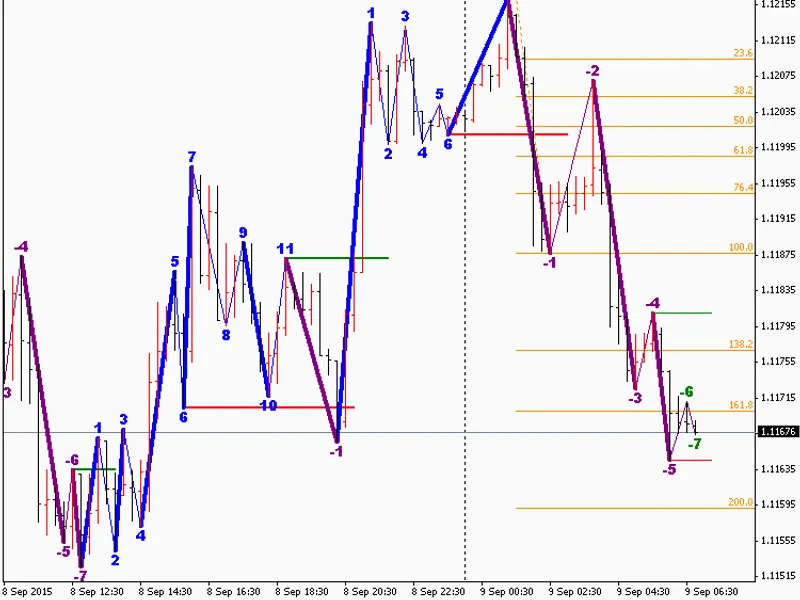
The Road Map indicator provides clear visual guidance for market analysis, akin to road signs on a journey.The indicator displays the following:- Impulse waves (indicated by bold s...
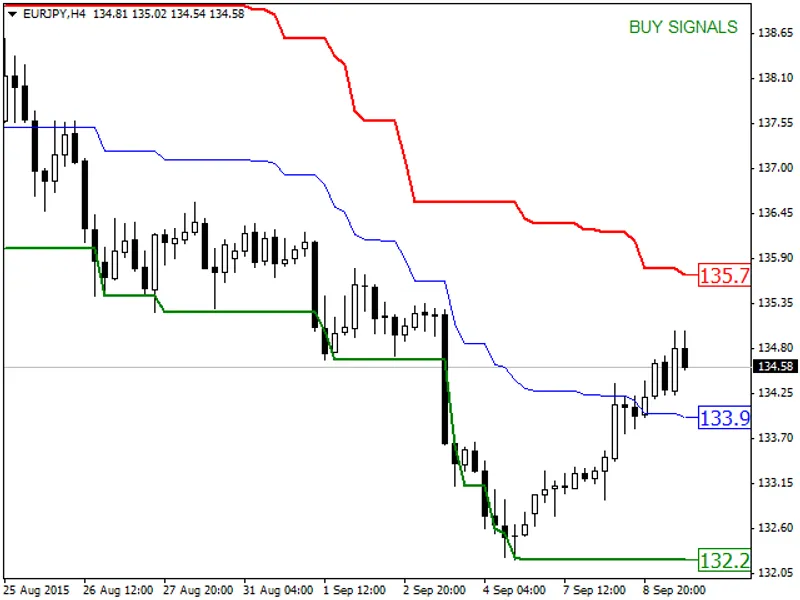
The Price Channel Indicator analyzes price movements within a defined range.The upper line of the channel represents the maximum price value over a specified number of bars.The low...
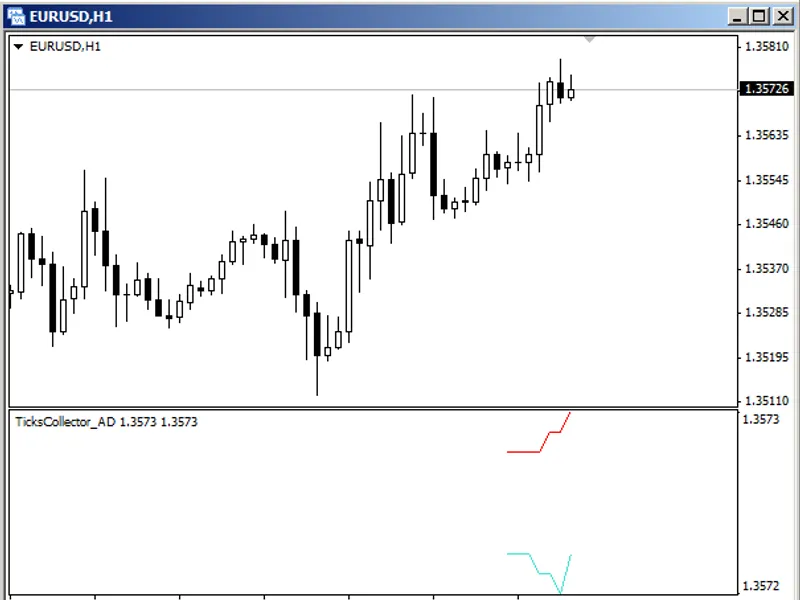
This indicator collects real-time price data, including tick arrival time, bid price, and ask price. The bid and ask prices are visualized as lines within the indicator's subwindow...
The Ticks Volume Indicator is a tool used to track volume changes during the trading day. In the futures markets, trade volume data is reported with a one-day delay. To compensate ...
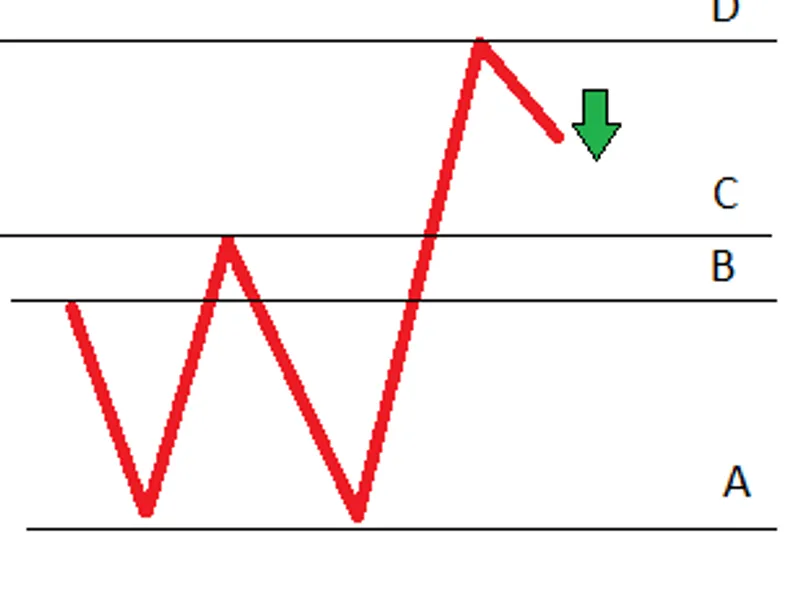
This indicator is based on a specific pattern, which is as follows:
A double bottom is identified where the c level is above the b level, and the d level is above the c level.
Hi...