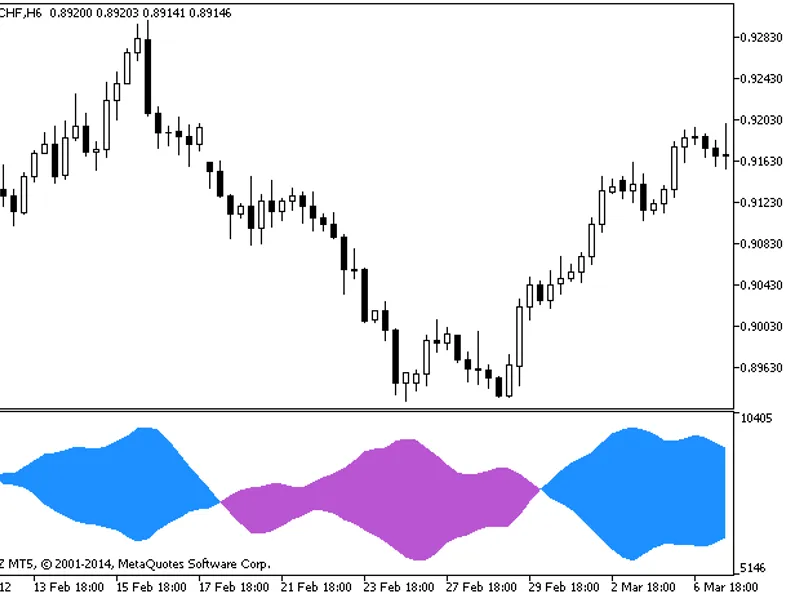
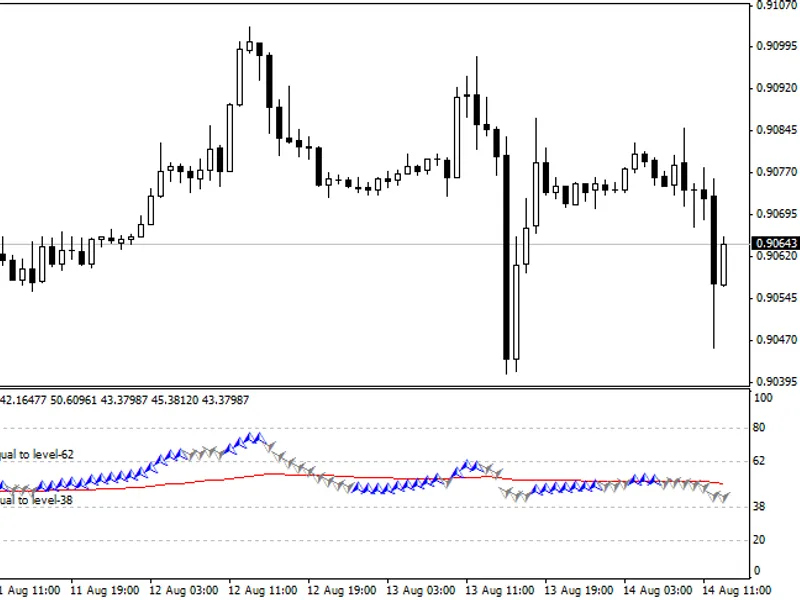
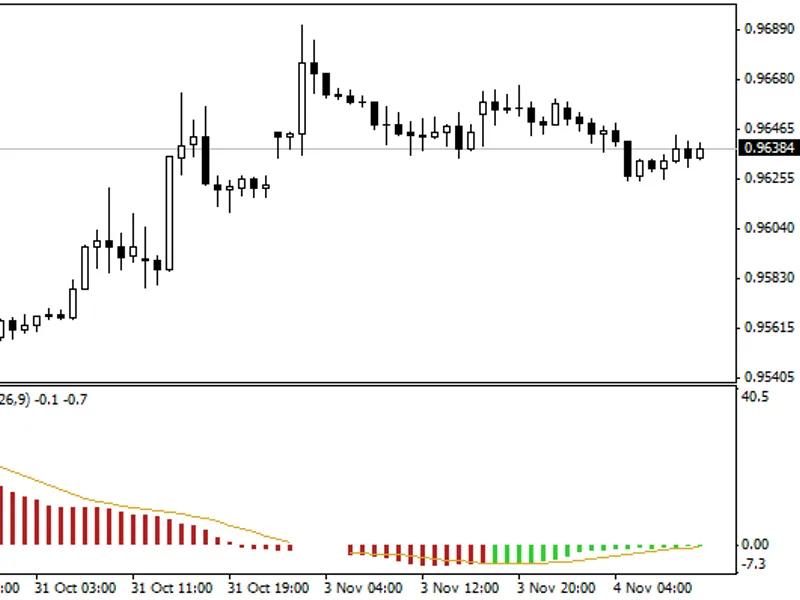
bbmacd_v2 is the Bollinger Bands® and MACD indicator in the same separate window.Last update: 20/03/2026 - Eliminated bugs in the use of facilities movingaverages.mqh....
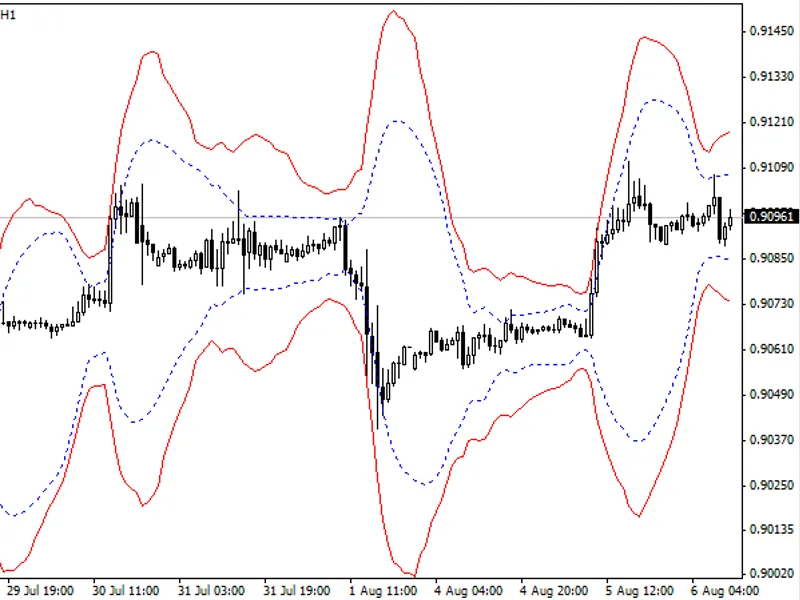
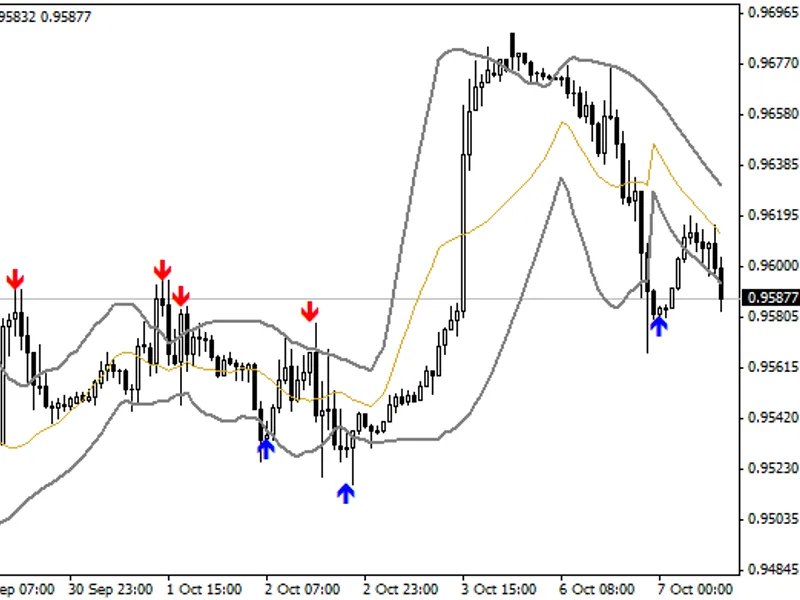
This indicator displays Bollinger Bands and ATR Bands, providing a comprehensive view of market volatility and potential trading opportunities.The Bollinger Bands, developed by Joh...
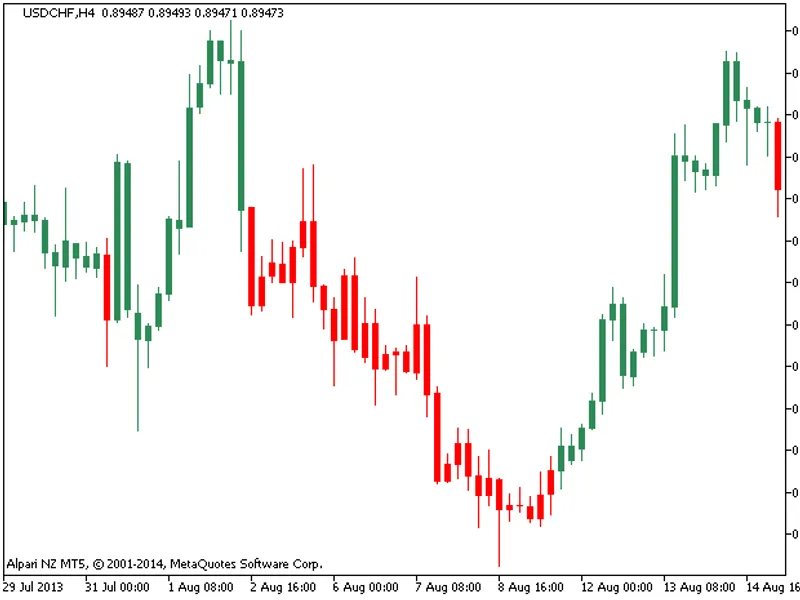
This indicator colors candlesticks based on the highs and lows of previous bars.The original indicator was written in MQL4 and published in CodeBase in 2026.Fig.1. Indicator Simple...
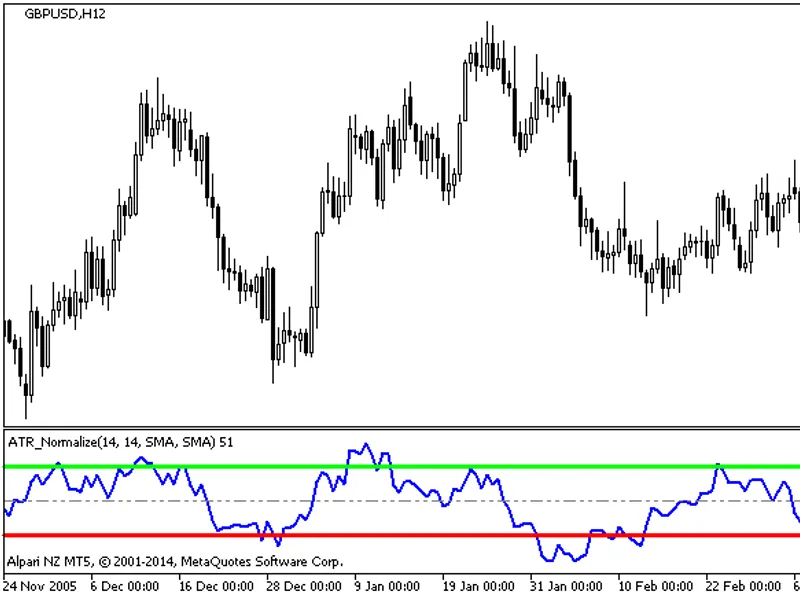
The ATR_Normalize indicator with the timeframe selection option in the input parameters:- Enum_Timeframes- Timeframe=- Period_H4// Indicator chart period (timeframe)For correct ope...
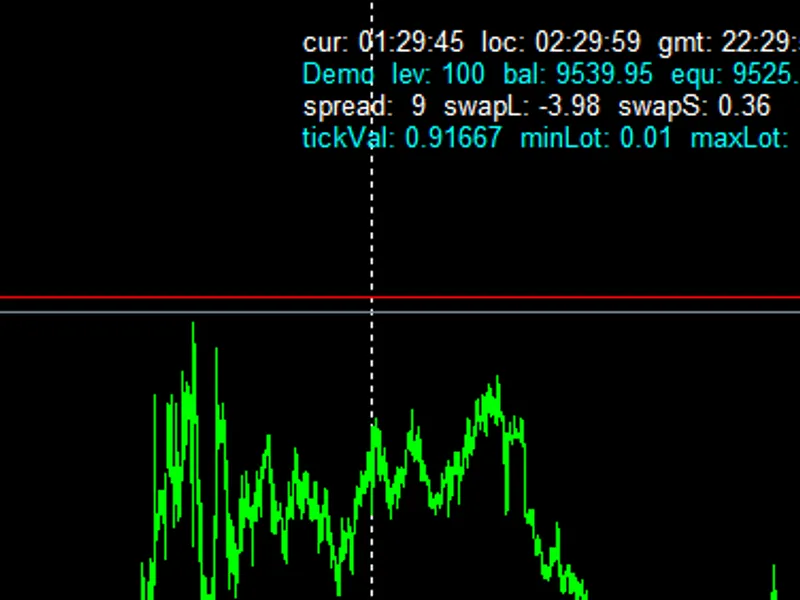
This indicator provides a comprehensive overview of essential trading data:Time:- Current time- Local time- GMTAccount Details:- Account type- Leverage- Current balance- Current eq...
Real-time indicator for MetaTrader 4/5.This indicator provides a simple and effective way to visualize moving averages on your charts, helping you make informed trading decisions....
The RegressionPolynomial indicator with the timeframe selection option is available in the input parameters:- enum_timeframes- timeframe=- period_h4// indicator chart period (timef...
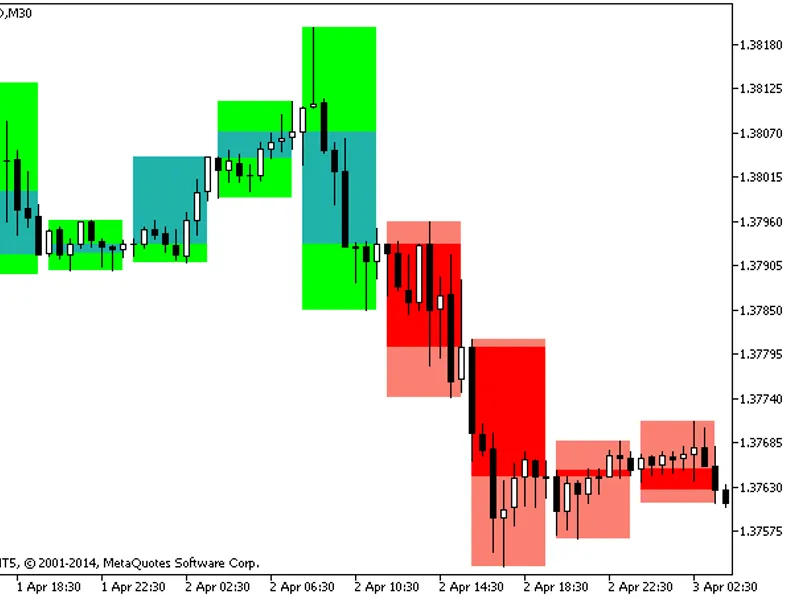
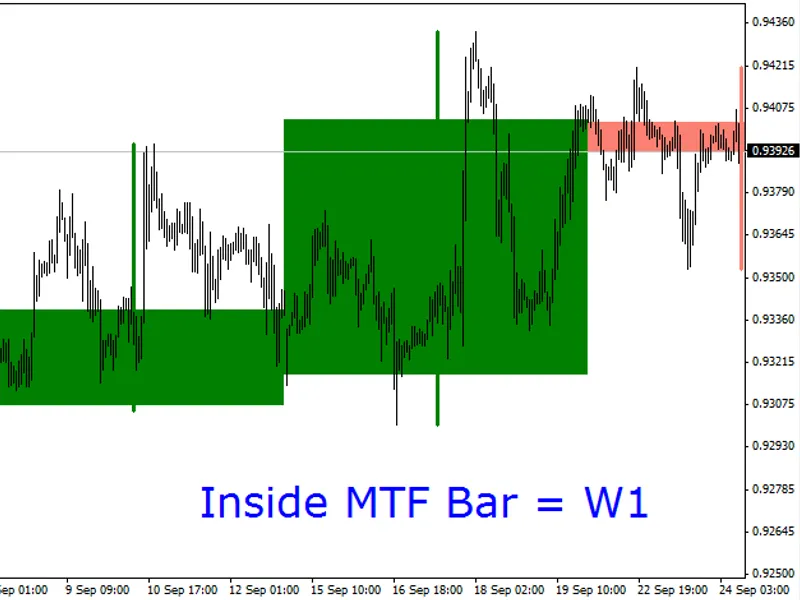
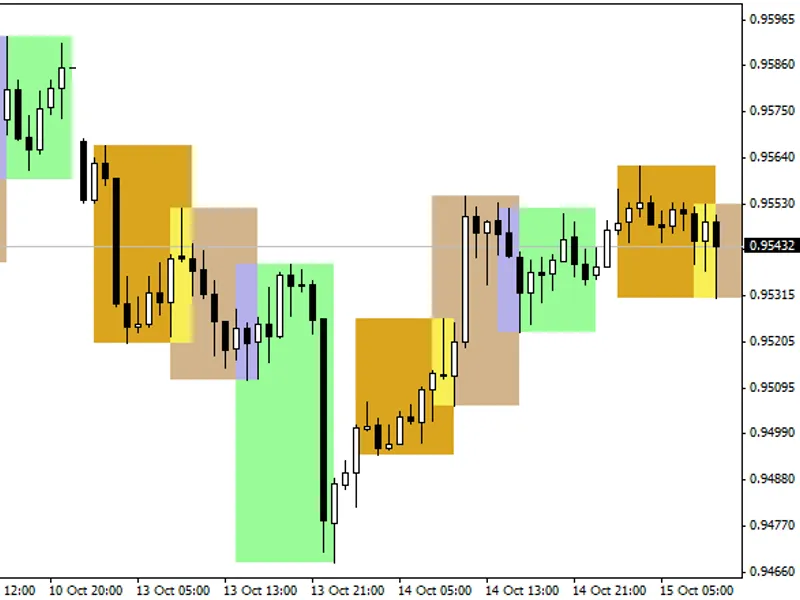
The indicator draws candlesticks of a larger timeframe as color-filled rectangles using draw_filling buffers. Rectangles are color-filled based on the values of the simplebars indi...
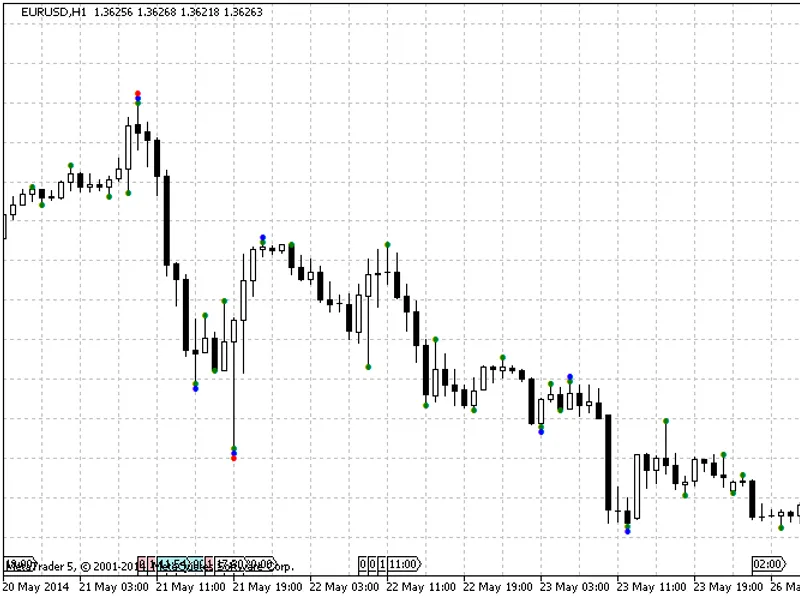
A MetaTrader 5 indicator that identifies short-term, medium-term, and long-term extreme points based on Larry Williams' book, "Long-Term Secrets to Short-Term Trading".Short-term h...
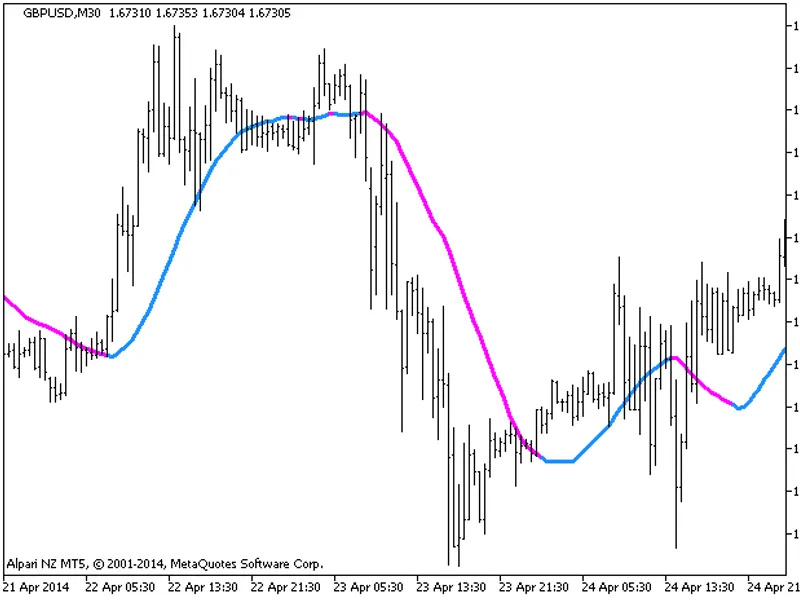
RealA semaphore signal indicator that uses the crossing of a classical moving average with Kaufman's AMA indicator.The original indicator was developed in the MQL4 language and pub...
The BVSB indicator with an enhanced feature: the ability to select the timeframe directly from the input parameters.Input Parameters:- enum_timeframes timeframe= period_h4// Indi...
A straightforward Zig Zag indicator with a concise code structure for accurate peak detection.This indicator is designed to provide a clear and reliable way to identify significant...
The KaufWMACROSS indicator with a versatile timeframe selection feature is now available, offering enhanced flexibility for traders.This indicator includes an input parameter for t...
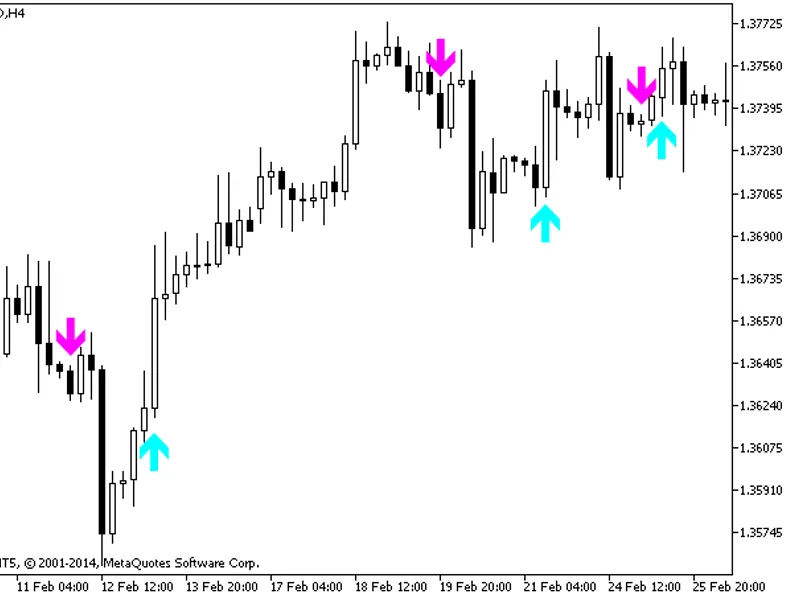
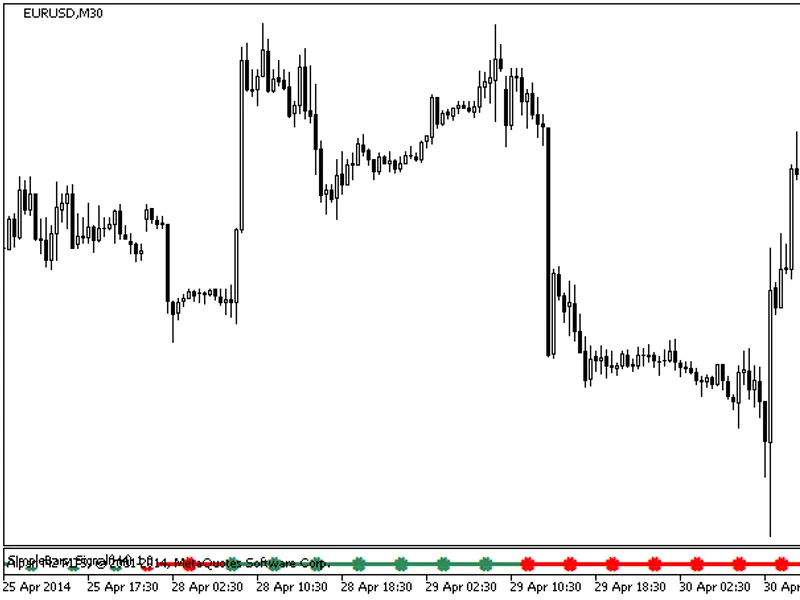
The Simple Bars Signal indicator provides valuable insights into the current trend by utilizing the values of the Simple Bars indicator with a fixed timeframe.This indicator visual...
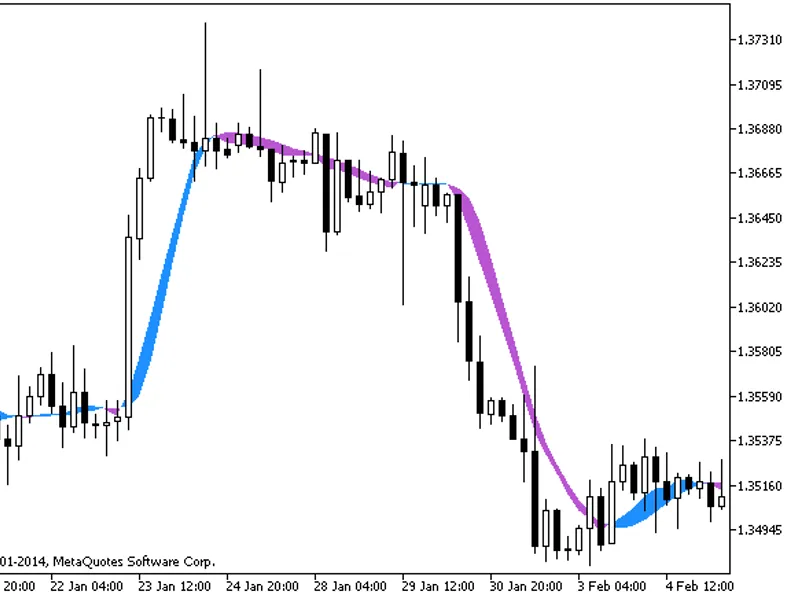
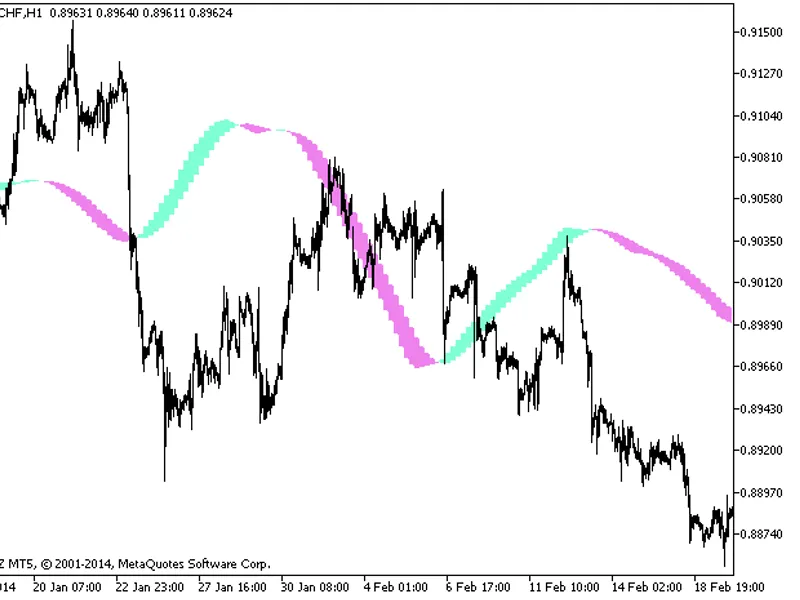
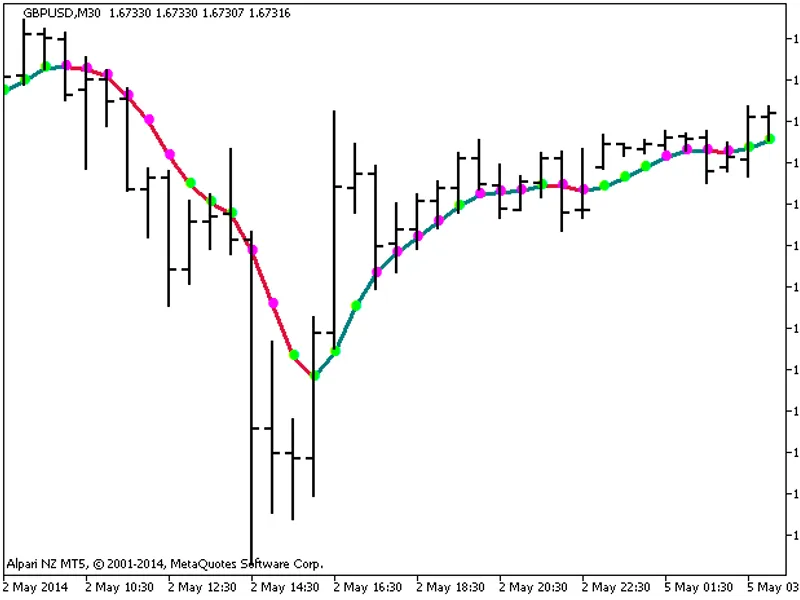
Real zzueggA moving average that processes price series using a Gaussian filter. The direction of the moving average is indicated by a specific color, and the color of the dots cha...
Real moving average of ranges.The calculation is based on the price high and low for a period.Originally, this indicator was written in MQL4 and published in the code base on 16.01...
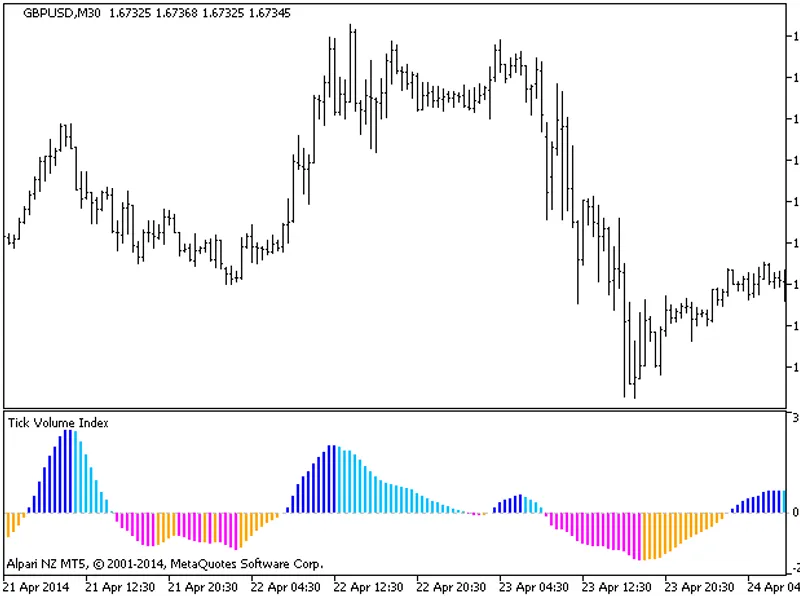
Tick volume indicator from the book "Momentum, Direction, and Divergence" implemented as a color histogram.The indicator utilizes the SmoothAlgorithms.mqh library classes, which sh...
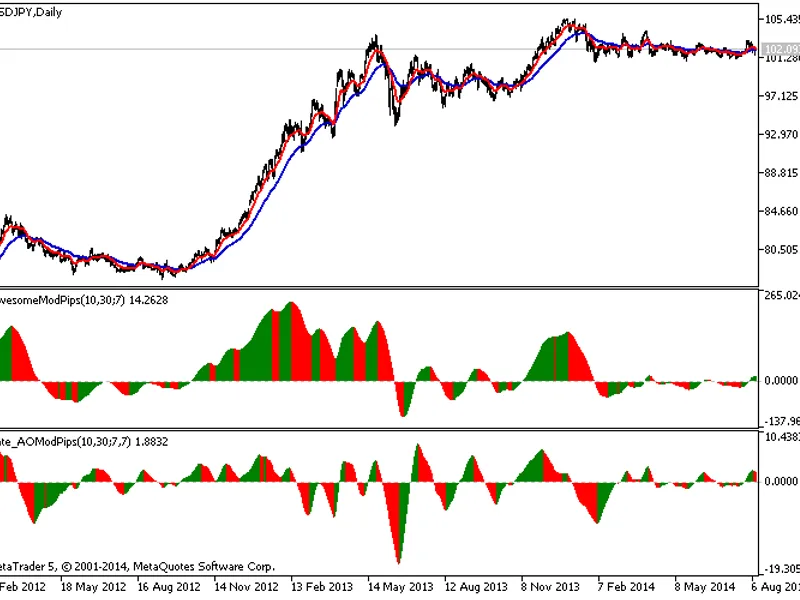
This indicator calculates the rate of change for the smoothed difference between two exponential moving averages, as provided by the AwesomeModPips indicator. It is a complementary...
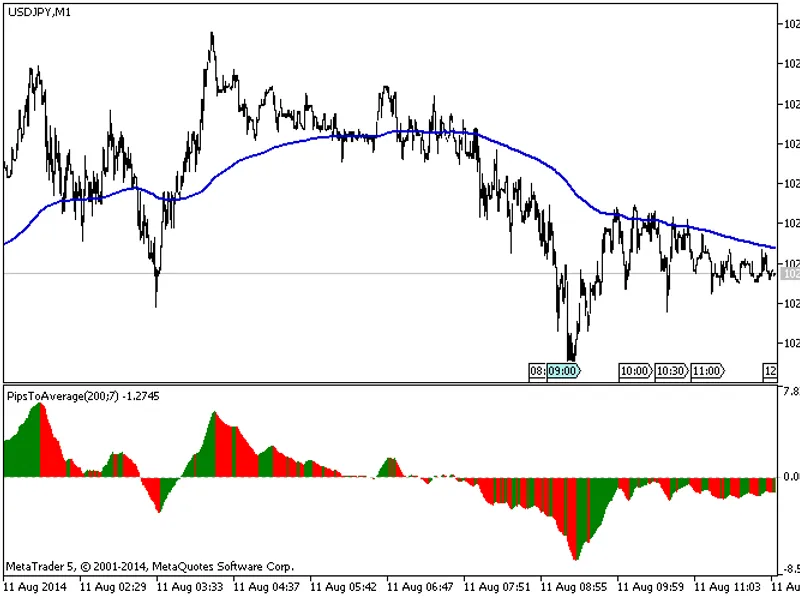
This indicator calculates the smoothed difference in pips between the closing price and an exponential moving average (EMA).The first input, 'period_average', determines the period...
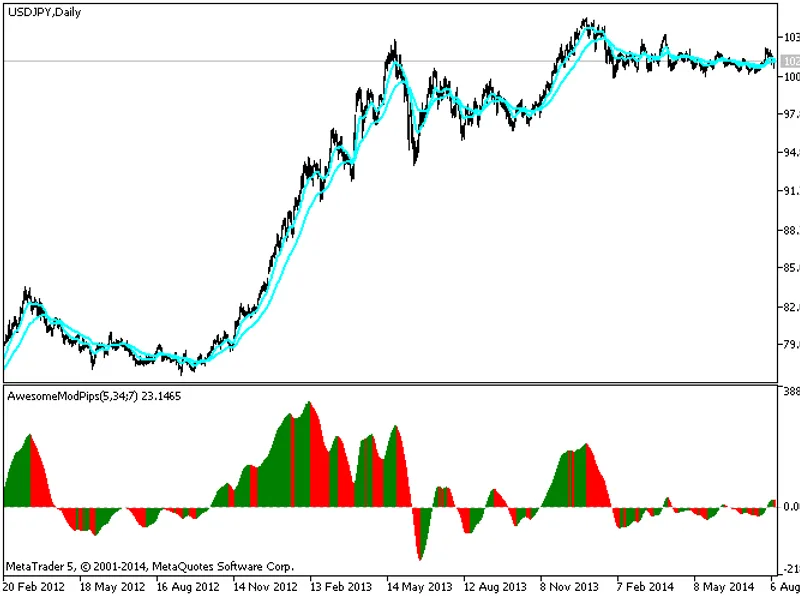
This indicator is a modification of the classic Awesome Oscillator, designed to calculate the smoothed difference between two exponential moving averages.The indicator features thr...
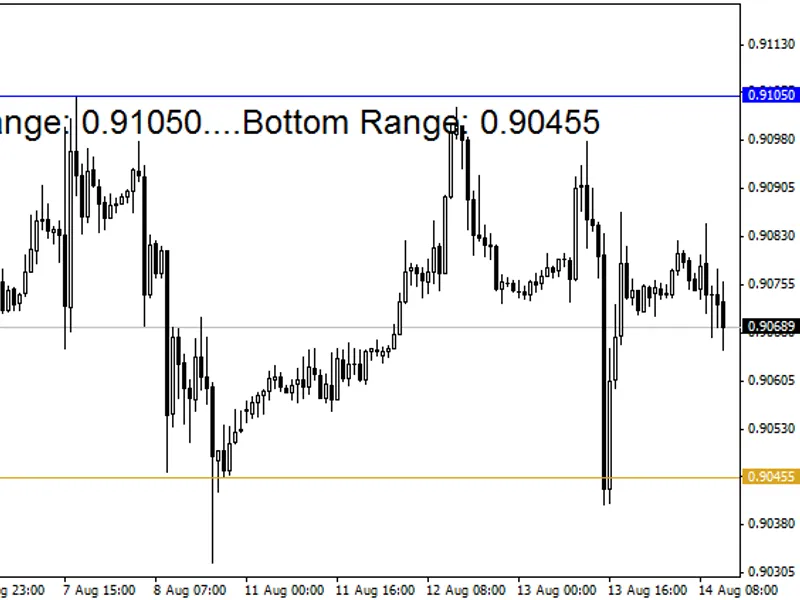
The Pip Striker indicator highlights the top and bottom ranges of price movement.To use:- Apply the indicator to a weekly chart, set the color, and remove it from the chart.- Repea...
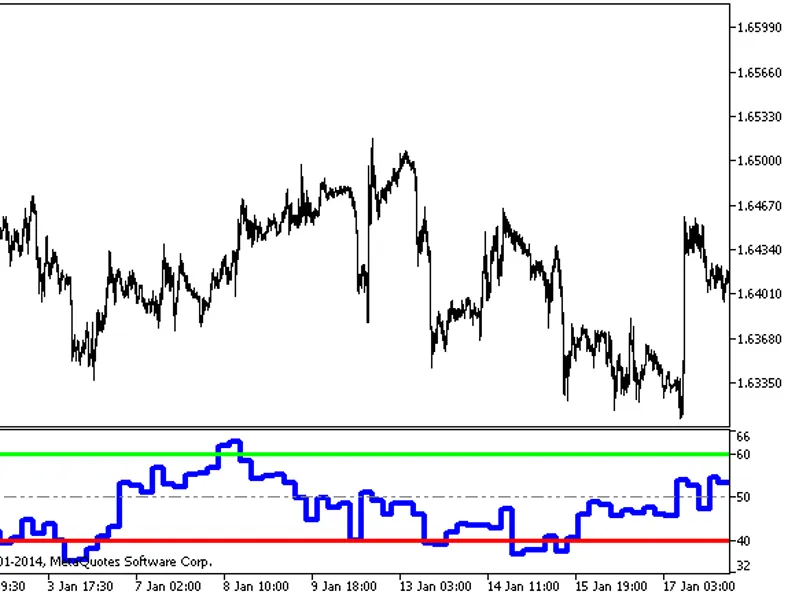
The Chain Price RSI indicator is a powerful tool for forex traders, combining the Relative Strength Index (RSI) and Moving Average (MA) indicators.This indicator provides trend lin...
This indicator draws horizontal grid lines at specified intervals, providing a clear visual reference for price levels.The image demonstrates the indicator's ability to display fra...
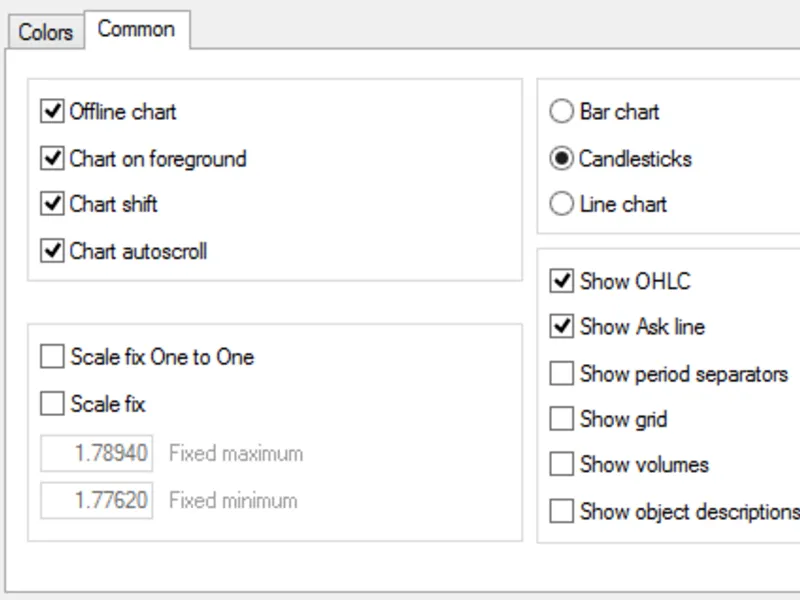
RealThe basic candlesticks built into MetaTrader 4 have a fundamental flaw that can be detrimental to trading. They fail to display the ask line and do not record the ask price in ...
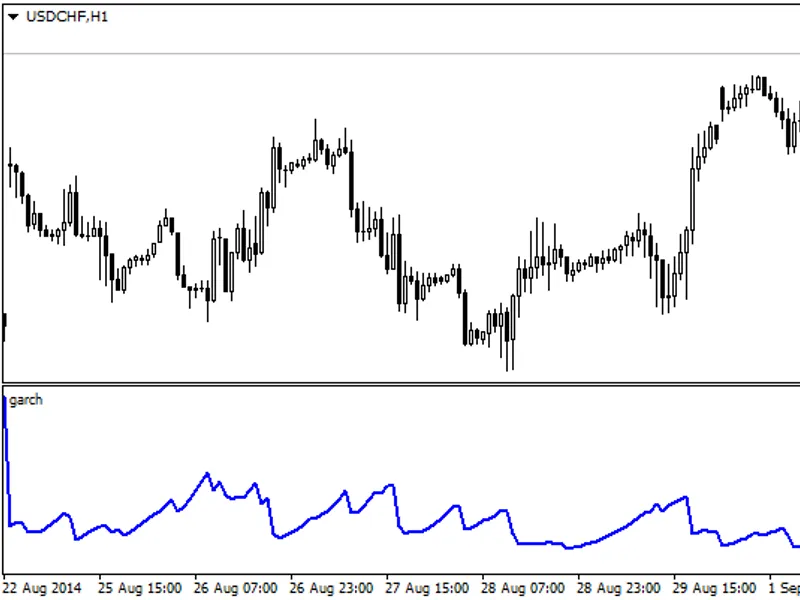
This is a contribution to the community, inspired by Edgar Peters' work. It is a fractal volatility indicator based on the Bollerslev model. Understanding forecast can be aided by ...
This indicator visualizes price action in a higher timeframe on your current chart.Features:- Select a specific timeframe (e.g., tfup=3 for the third timeframe above the current ch...
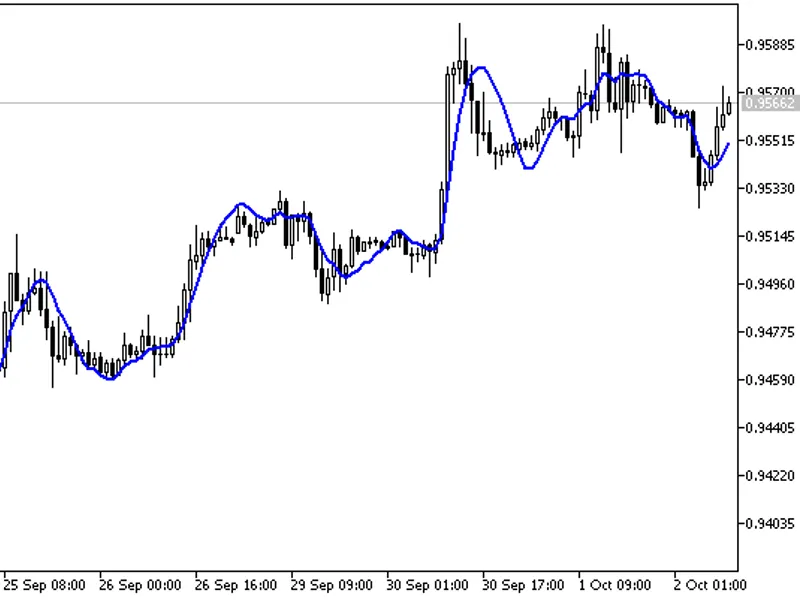
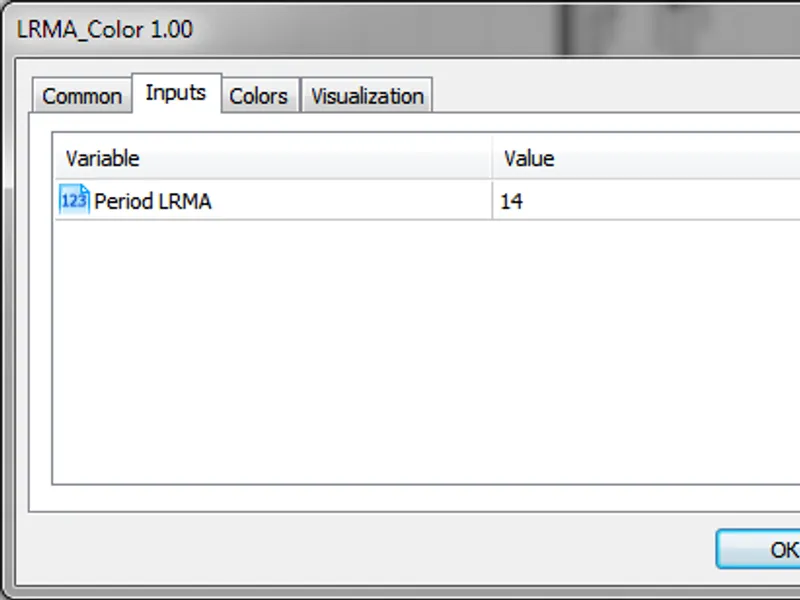
The Linear Regression indicator is a powerful tool for predicting future price movements in the financial markets. It utilizes a statistical approach to forecast prices based on hi...
The Linear Regression Indicator is a powerful tool for traders, utilizing linear regression to forecast future price movements based on historical data.This indicator employs the l...
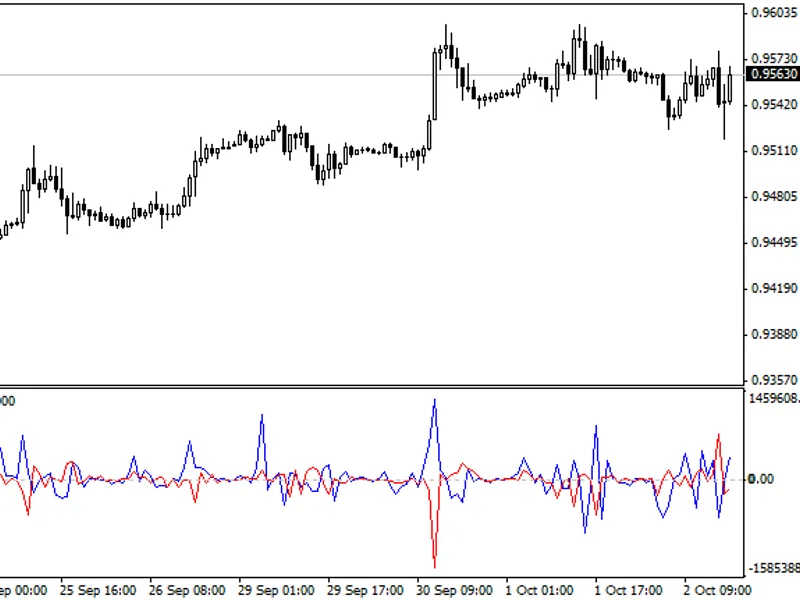
Netflows is an indicator that calculates the volume-adjusted flow of a currency, considering all available currency pairs on your trading platform.This indicator provides valuable ...
This indicator provides a visual representation of market sessions, highlighting the Tokyo, London, and New York sessions.Key Features:- Displays three major market sessions.- Excl...
The indicator combines Moving Average (MA) channels and Bollinger Bands. The MA indicator has been shifted, providing a forward-looking perspective for traders.This tool offers a u...
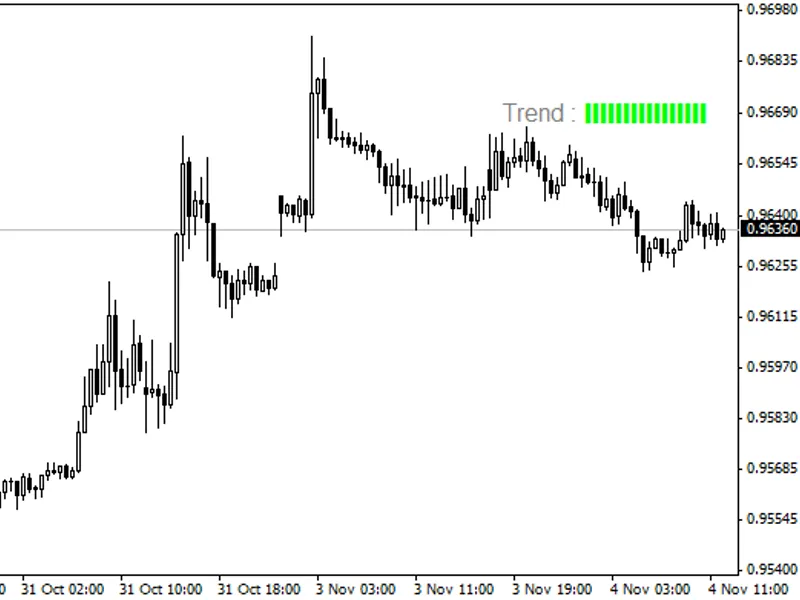
This indicator displays the trend based on the EMA200 of a higher timeframe. It is designed to assist traders by providing a visual representation of the trend on a different timef...
This indicator displays the MACD, Stochastic, RSI, or CCI of three different timeframes in a separate window.A versatile tool for multi-timeframe analysis, it offers a comprehensiv...
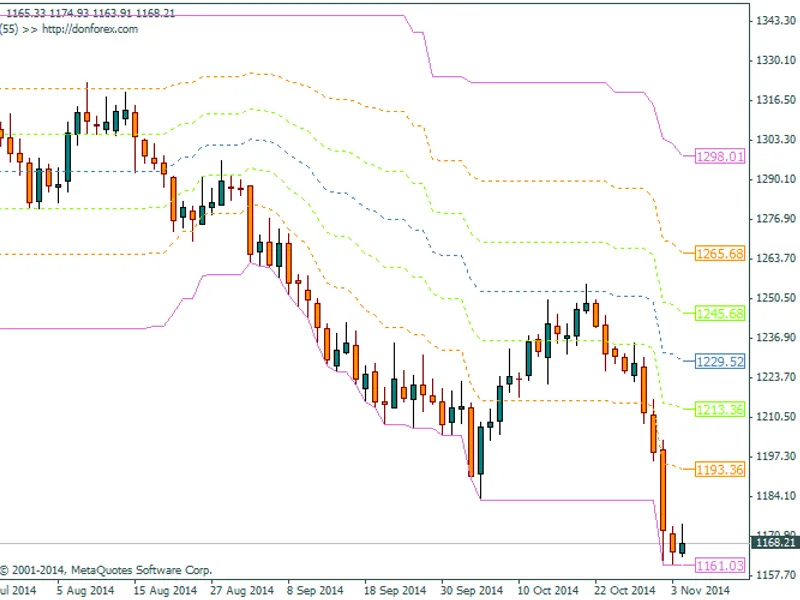
This indicator combines two classic tools: the Donchian Channel and Fibonacci retracement levels.Adjustable parameters:- Donchian_Period: Set the period for the Donchian Channel.- ...
A simple and efficient ticks recorder.This indicator automatically logs every tick into a .csv file, conveniently located in the /mql4/files folder for easy access and analysis....
This indicator script exports data to a CSV file for further analysis.The original code was adapted from Heaton Research's Encog project, which gathers data, prints it to a CSV fil...
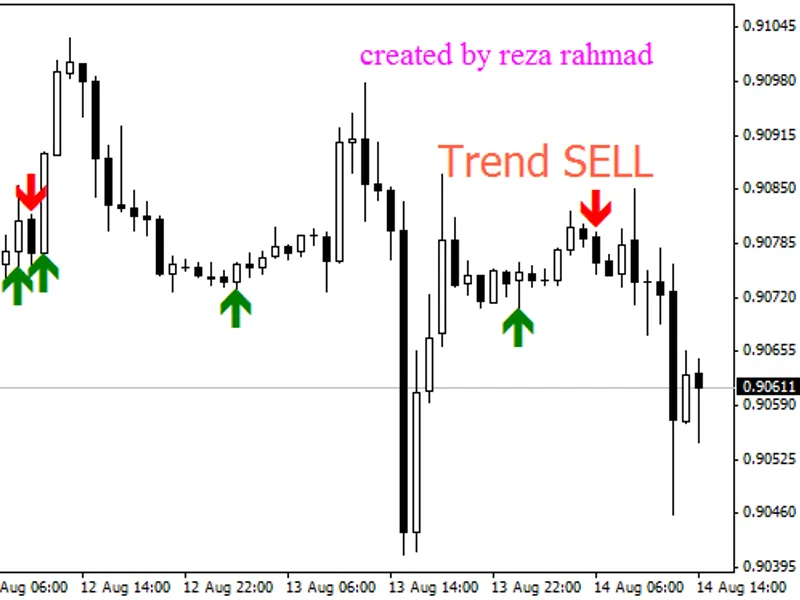
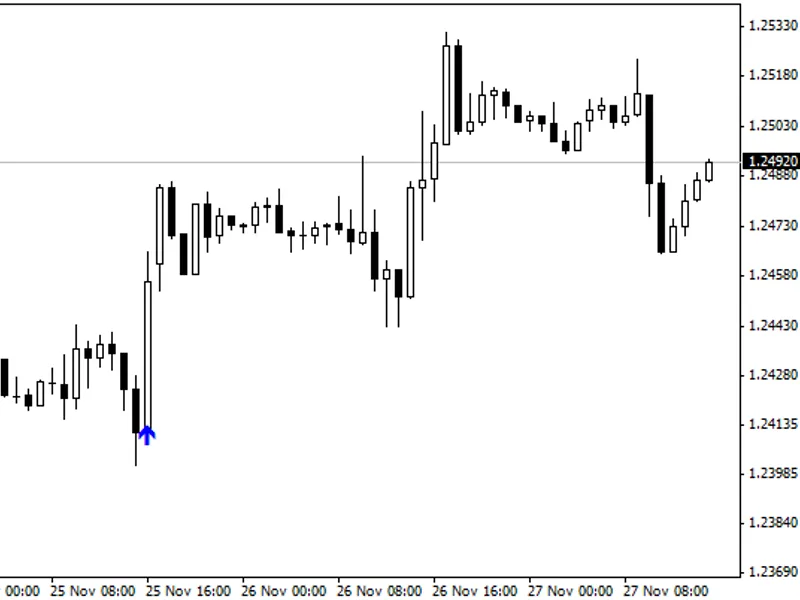
The indicator provides visual cues on the chart to indicate potential buy or sell opportunities.It is most effective for time frames longer than M30....
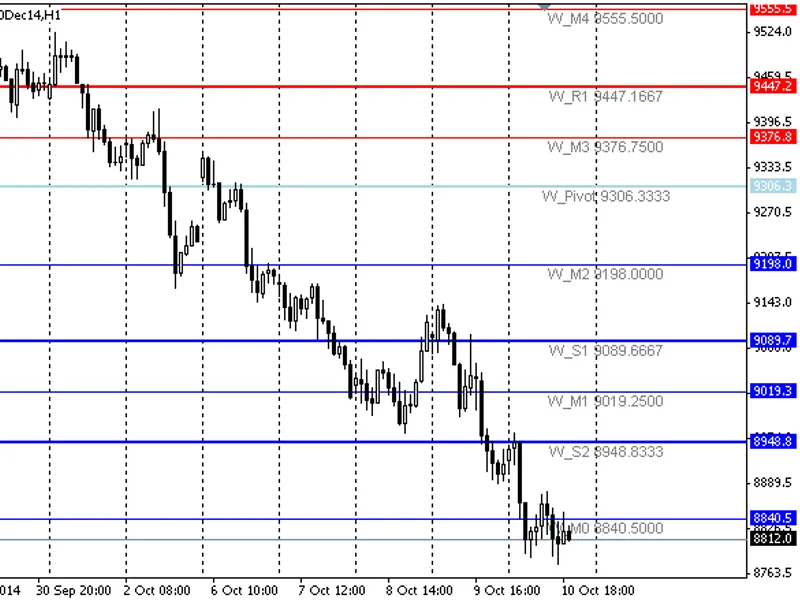
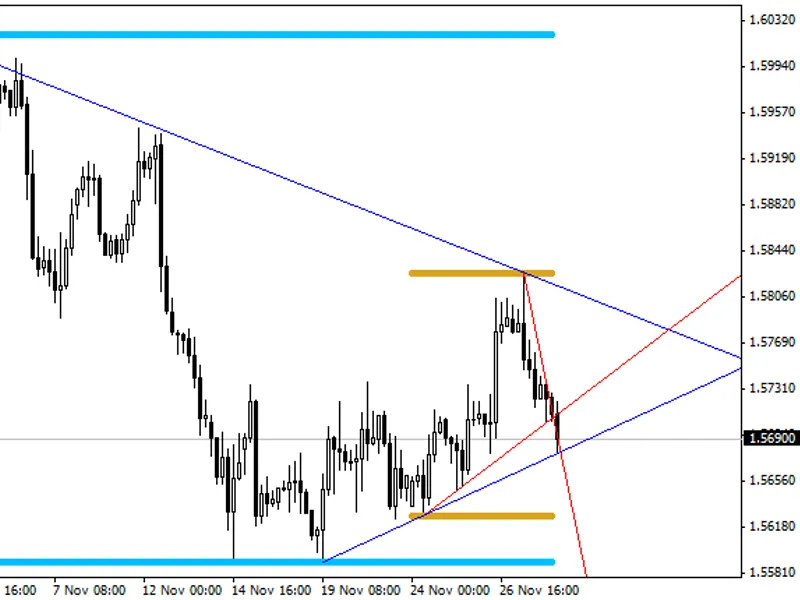
This indicator connects daily, weekly, monthly highs/lows with trend lines to determine the market direction. The levels themselves (highs/lows) are also plotted on the chart, prov...
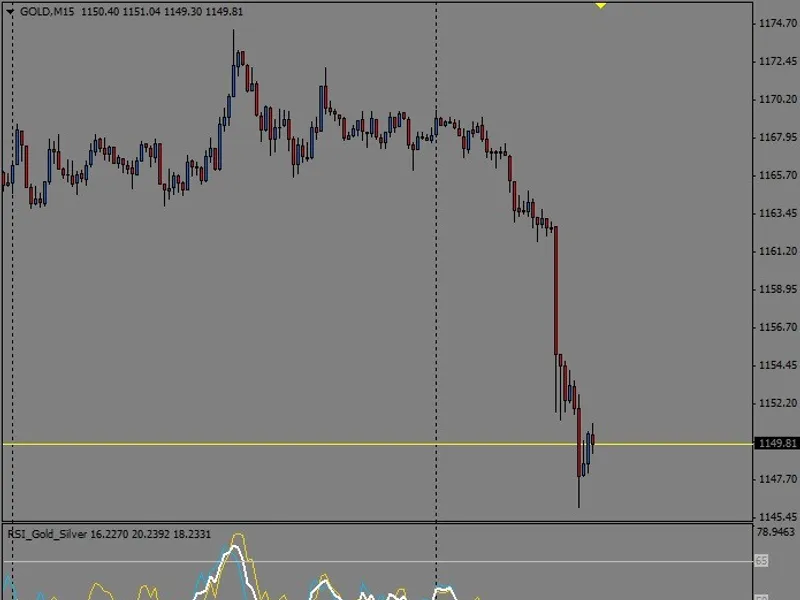
RSI Average Commodity for Gold and Silver.This indicator is designed to provide a comprehensive view of the Relative Strength Index (RSI) for two precious metals: Gold and Silver.B...
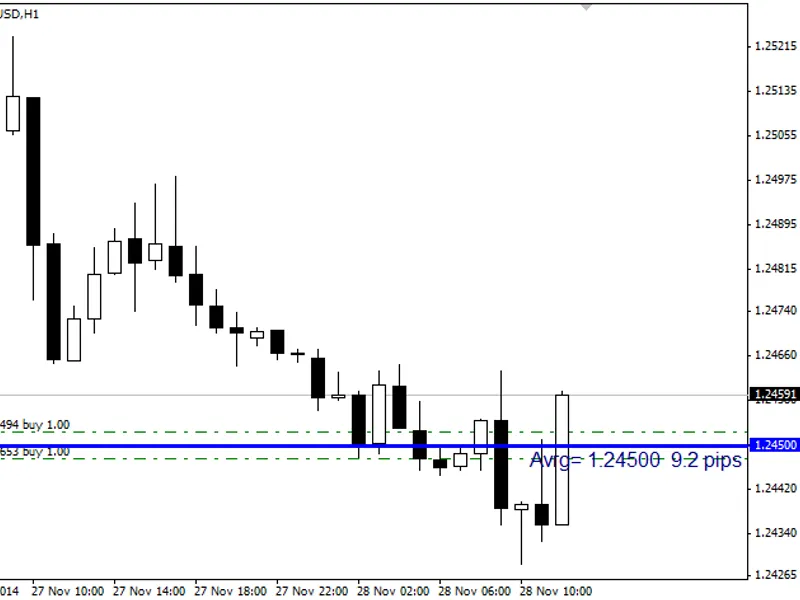
This indicator displays a horizontal line at the average price for multiple positions, with color-coding based on the overall position: blue for buy, red for sell, and white for ne...
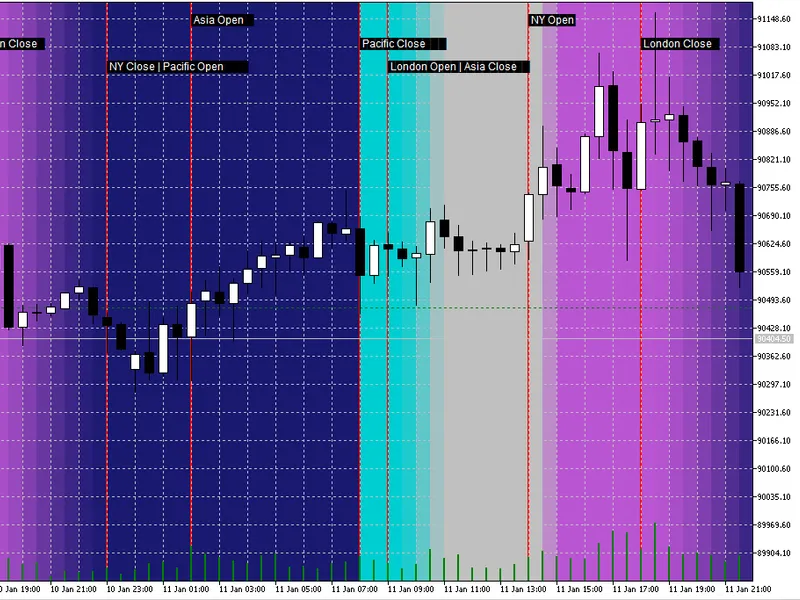
Session Daylight Gradient is an ambient session awareness indicator for MetaTrader 5, designed to provide a subtle yet informative visual representation of market sessions.Instead ...