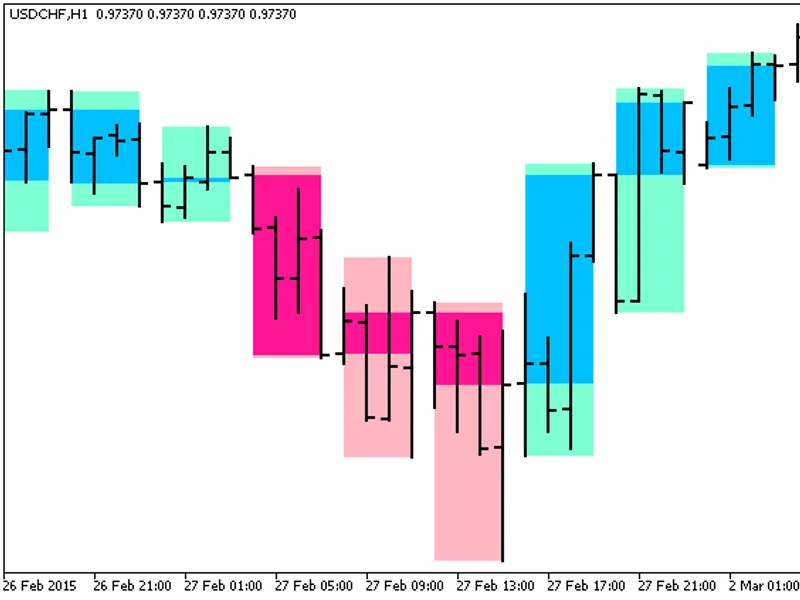
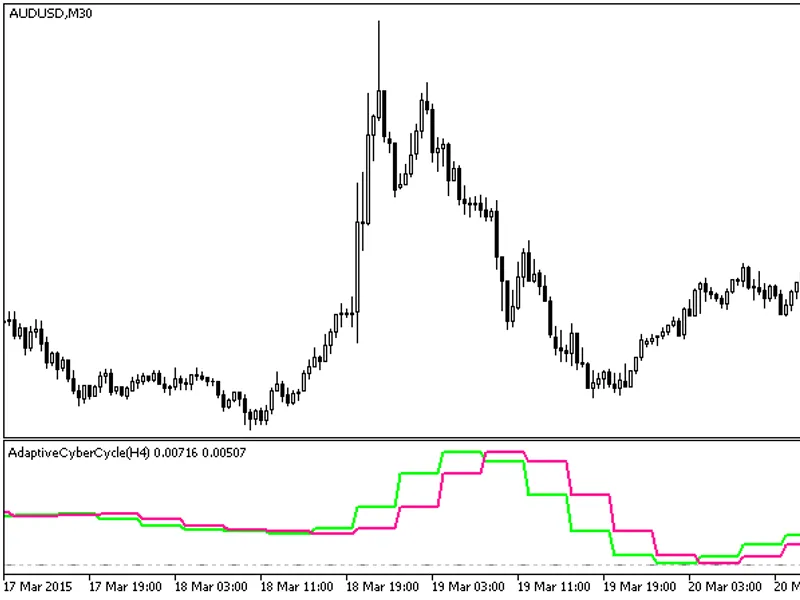
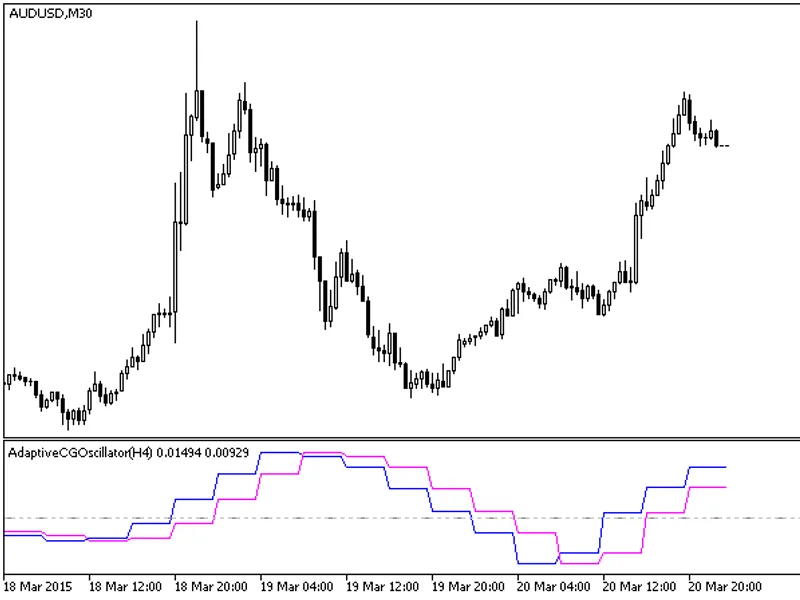
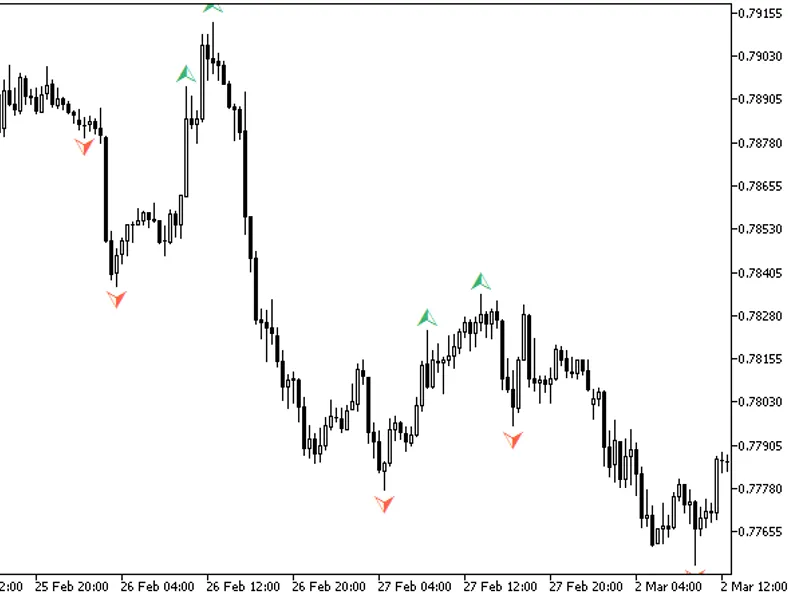
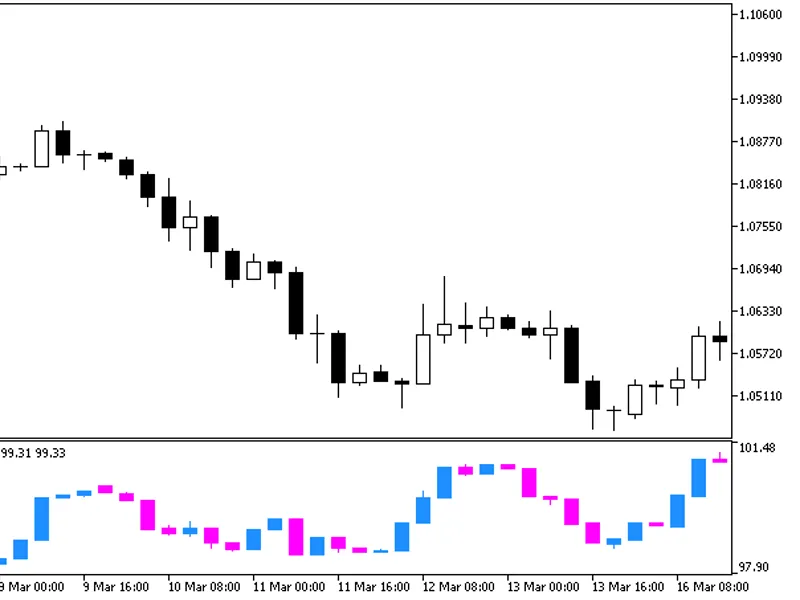
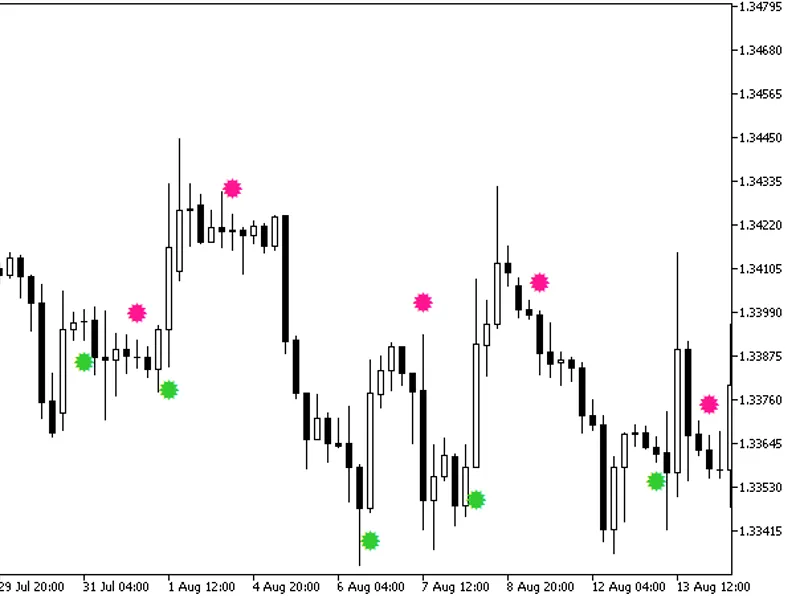
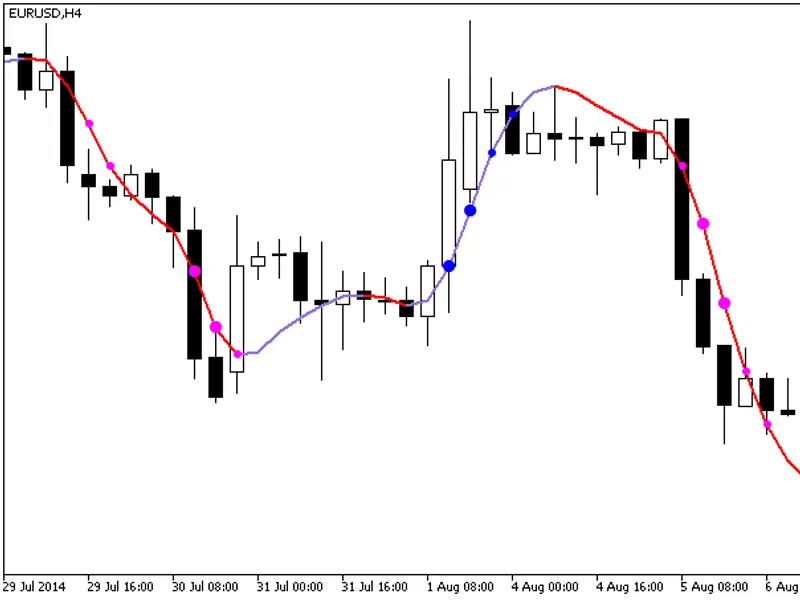
The Ex Trend Cloud HTF indicator offers a unique feature: the ability to select the timeframe in the input parameters.This indicator requires the 'extrend.mq5' file, which should b...
The indicator displays candlesticks of a higher timeframe as color-filled rectangles, utilizing buffers for rendering.Candlestick bodies are colored blue or deep pink, and shadows ...
The indicator offers a unique feature: the ability to select the timeframe in the input parameters.To utilize this indicator, you'll need the following files: adaptivecybercycle.mq...
The indicator with the timeframe selection feature in the input parameters.It requires the following indicator files: adaptivecgoscillator.mq5 and cycleperiod.mq5. Place these file...
This indicator offers enhanced functionality, allowing users to define the number of candlesticks on each side for fractal determination.Additionally, it enables the setting of a m...
The indicator offers a timeframe selection option in its input parameters.Note: The indicator requires the 'afl_winner.mq5' indicator file. Place it in \mql5\indicators....
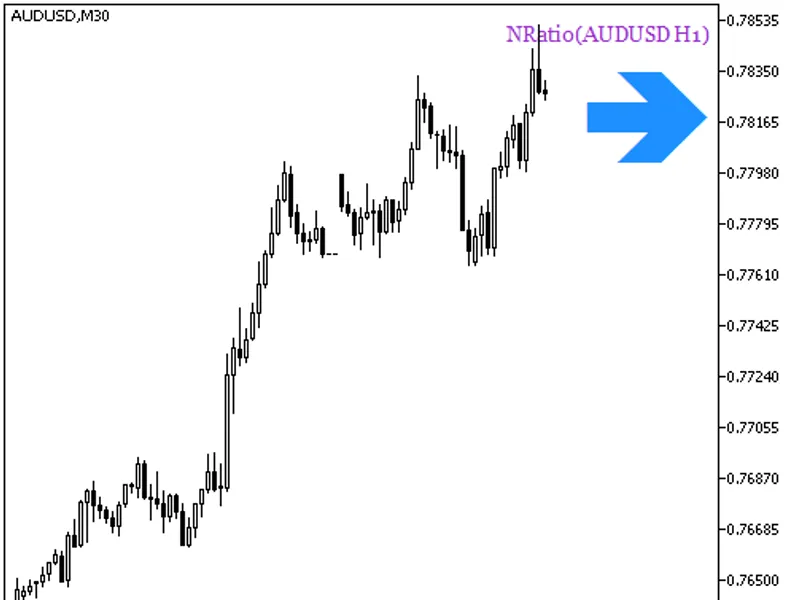
The NRatio_HTF_Signal indicator provides a visual representation of trend direction and signals on a chosen bar as a graphical object with colored trend indication or deal directio...
The AdaptiveRVI indicator with the Timeframe Selection option is available in the input parameters.This indicator requires the AdaptiveRVI.mq5 and CyclePeriod.mq5 indicator files. ...
A semaphore signal indicator designed to provide trading signals based on the AdaptiveRVI oscillator's main and signal lines. This indicator is a valuable tool for traders seeking ...
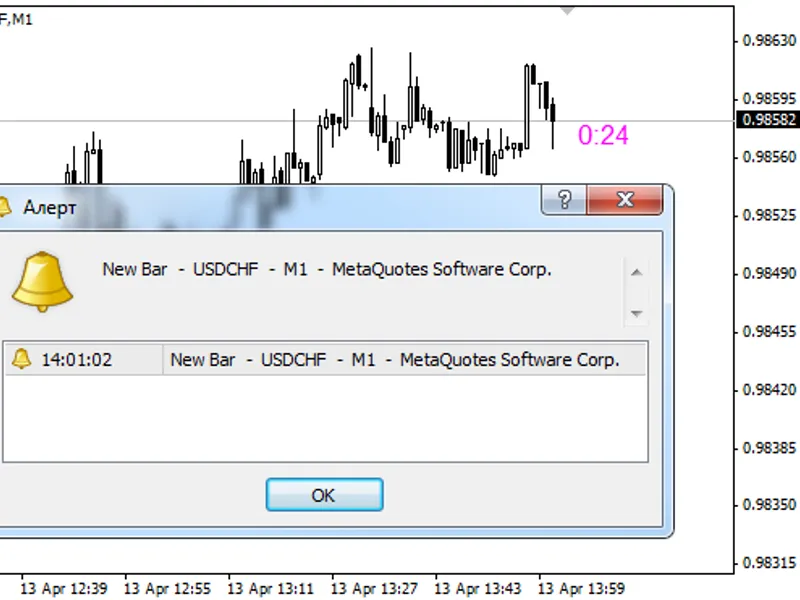
The indicator is a second-by-second candle timer not dependent on incoming ticks.It has three key functions:- Counts down the remaining candle time.- At the open of a new candle, i...
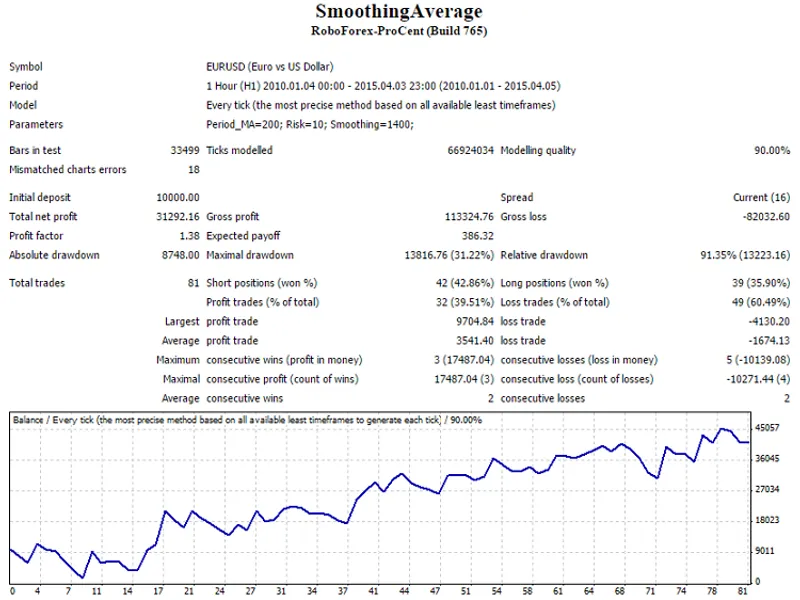
This Expert Advisor (EA) utilizes a single Moving Average (MA) indicator with a unique 'smoothing factor' to determine entry and exit points based on a fixed pip distance from the ...
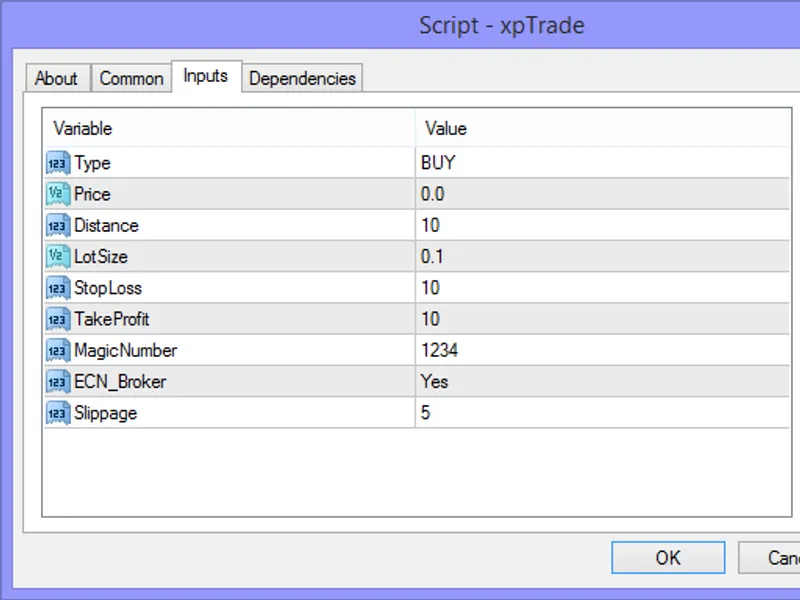
This script simplifies the process of opening a trade and setting stop loss/take profit.To use it, copy the script to the <terminal_data_folder>\mql4\scripts folder and drag ...
This indicator offers a unique feature beyond the standard horizontal bar shift. It enables users to vertically shift the moving average, providing a valuable tool for technical an...
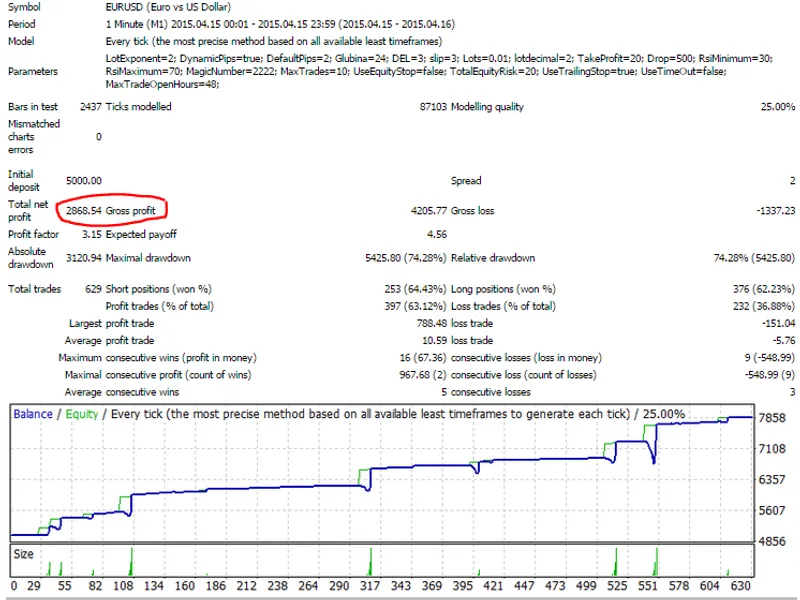
This Expert Advisor (EA) is designed for scalping strategies, offering a range of sensitive features to capture market movements.Features:- Equity Stop- Trailing Stop- Equity Risk ...
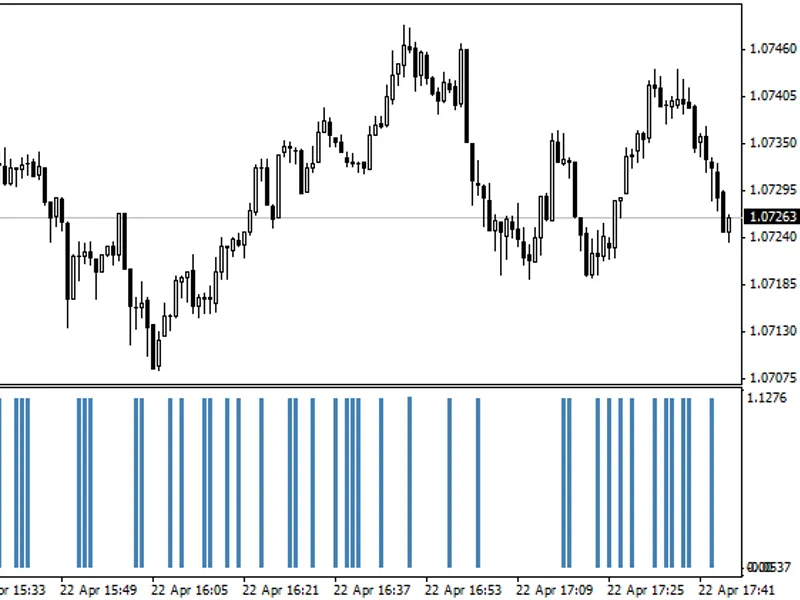
This indicator is designed for chart pattern analysis, specifically to identify Doji candles and provide visual and alert-based notifications.Key features include:- Compatibility w...
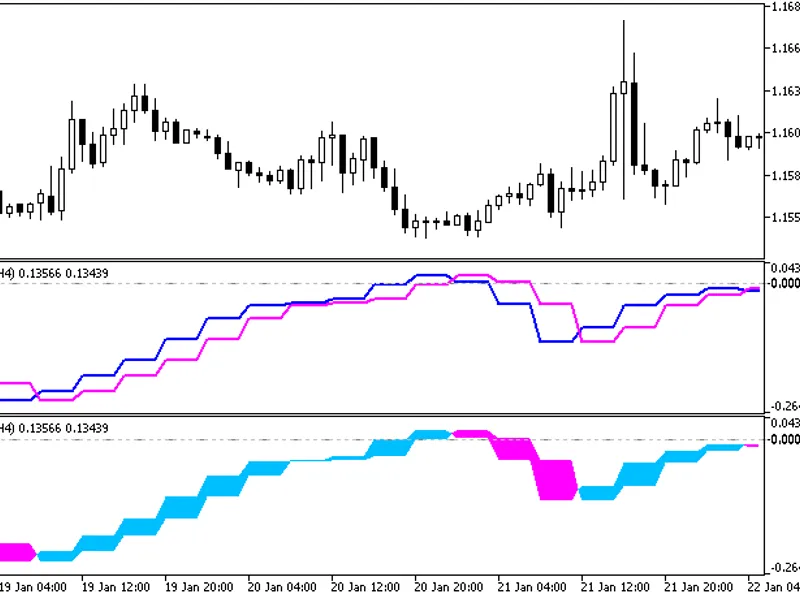
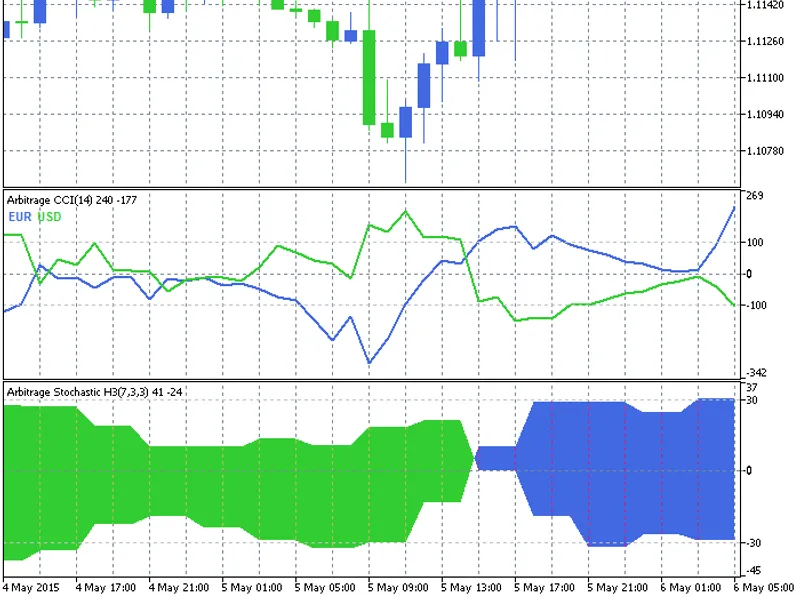
This indicator is designed to assist traders in identifying arbitrage opportunities by visualizing the difference between two currencies derived from three pairs/currencies.It is a...
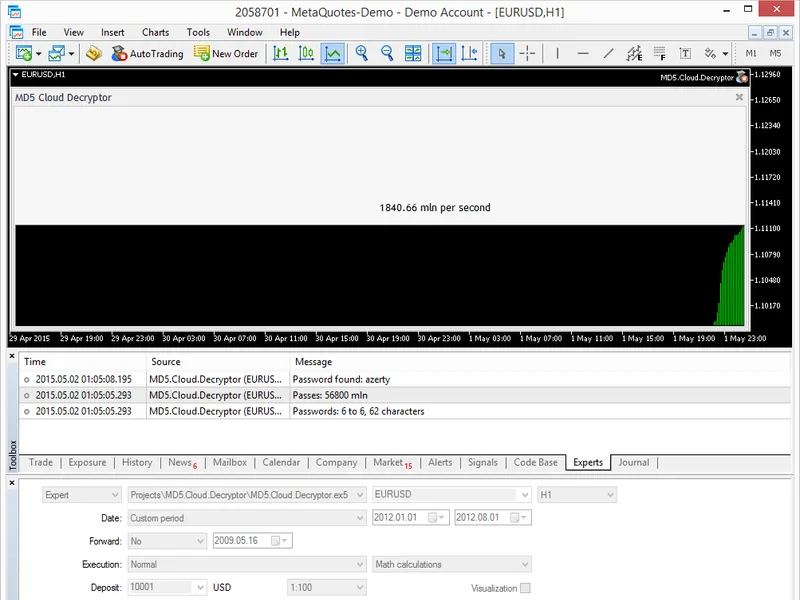
This example demonstrates the efficient utilization of custom data frame transmission for distributed brute force search aimed at cracking MD5 hashes.The system operates by sending...
Hunter EA V2 is a powerful trading tool with dual trading modes, offering a standard FVGLibrary mode and an Encroachment mode for more conservative trading.In standard FVGLibrary m...
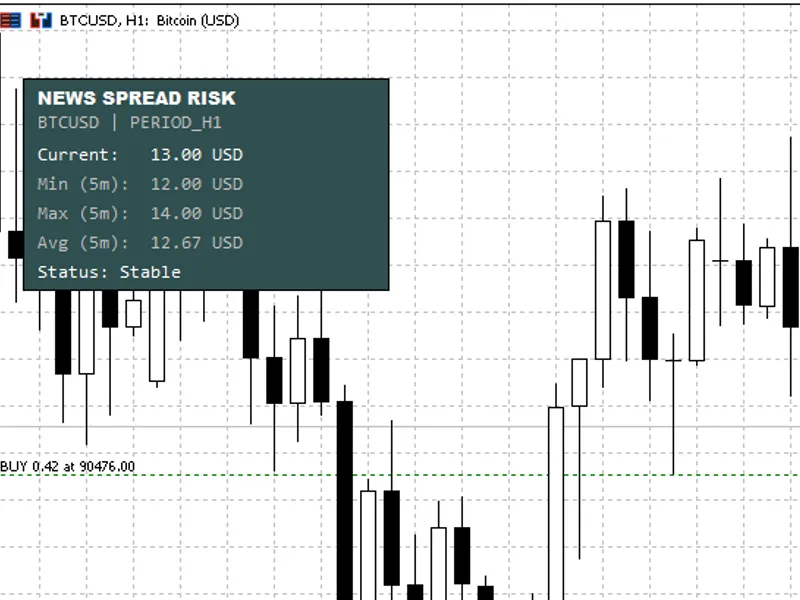
The News Spread Risk Dashboard is a lightweight chart-overlay indicator designed to assist traders in identifying potentially hazardous market conditions where spread expansion can...
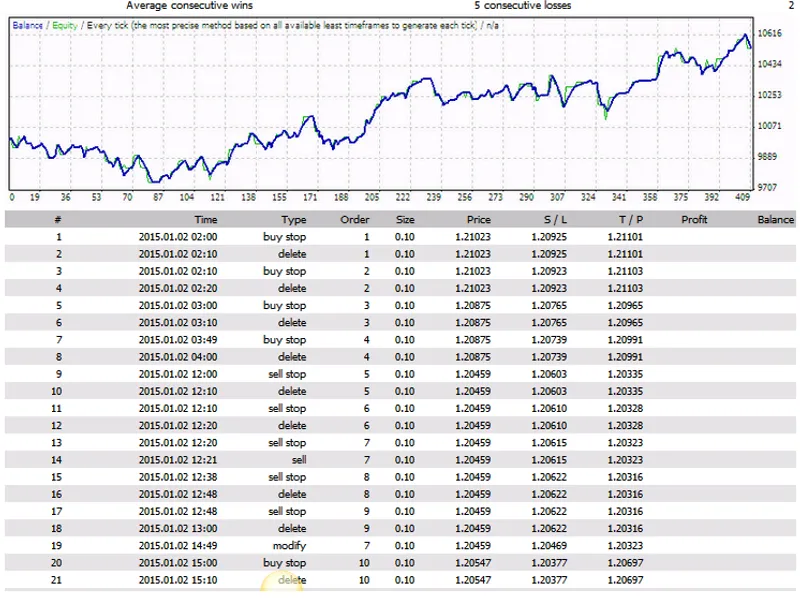
Note: After detecting an order block, the strategy immediately trades on the open of the next candle.Warning: This strategy has not been optimized and is provided for educational p...
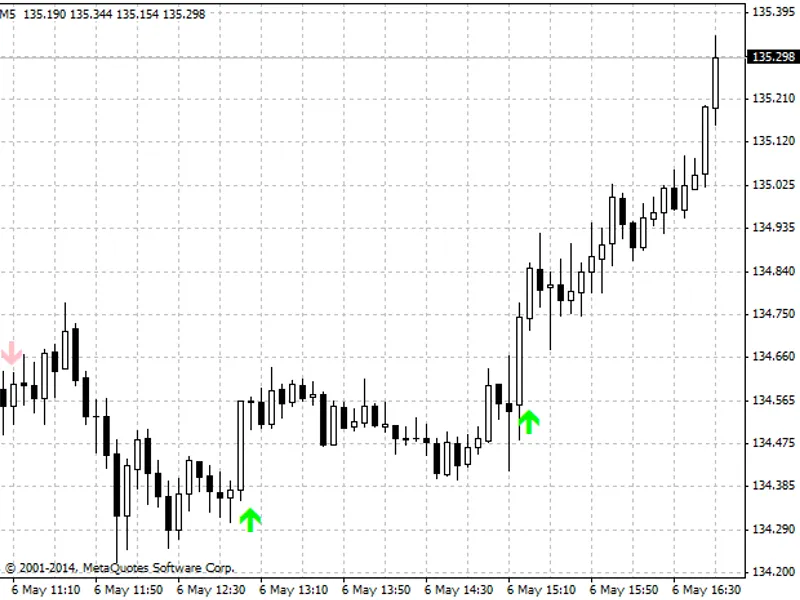
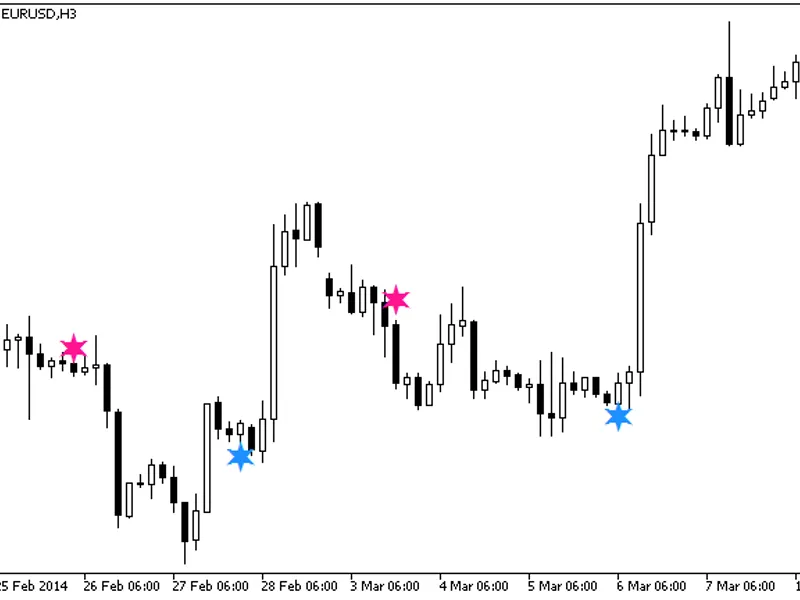
This indicator identifies the strongest trend each day based on price action. It is designed to be used when the ATS displays a clear bullish or bearish trend.Usage:- Pink arrow in...
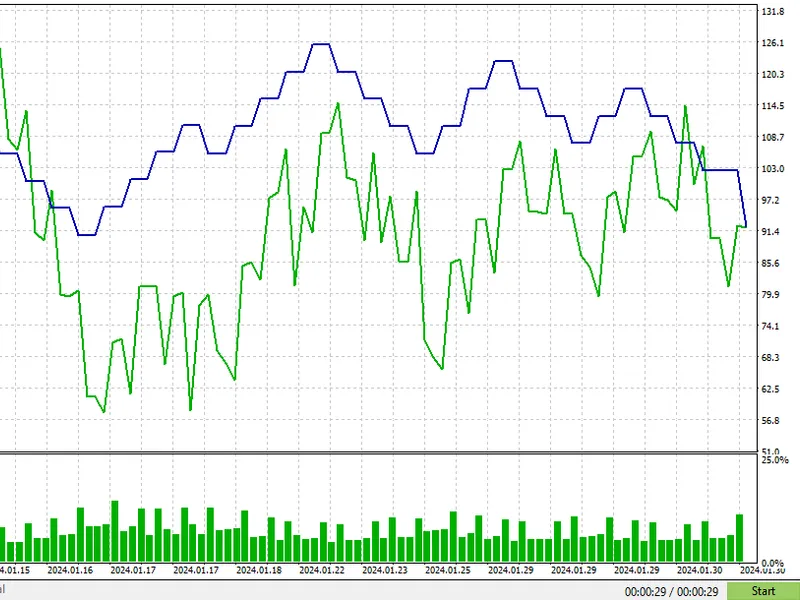
The indicator plots two lines, illustrating the difference between two currencies derived from three pairs/currencies.Applicable to the following currency pairs:- EURUSD- EURJPY- G...
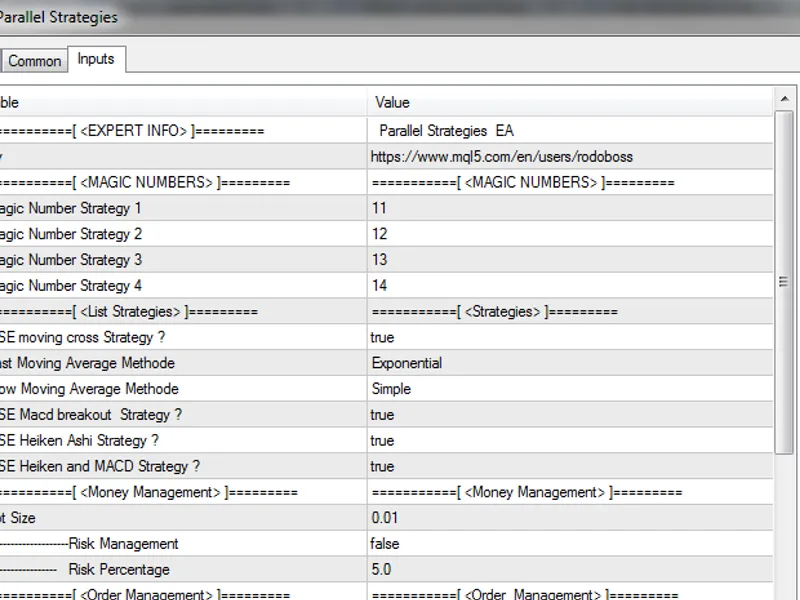
This Expert Advisor (EA) employs multiple strategies operating in parallel, each with distinct parameters and rules. Strategies include Moving Average Crossover, MACD Breakout, Hei...
This EA is a modified version of an indicator, optimized for promising results.Recommended settings:- Timeframe: 1 hour- Currency: EURUSDThe default settings have been carefully co...
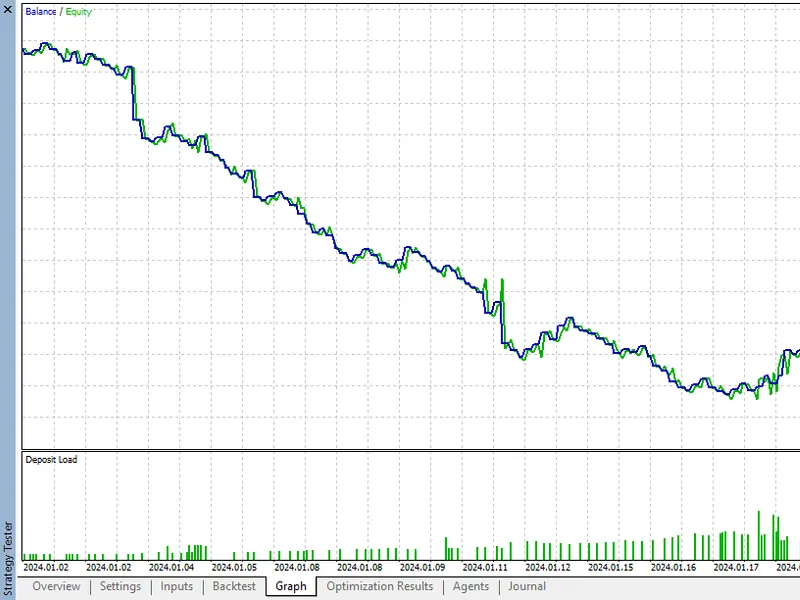
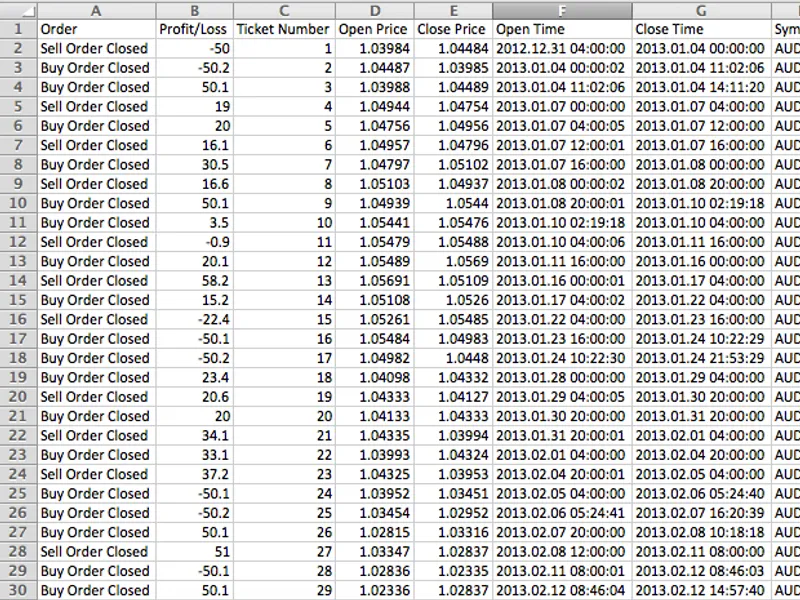
Export trade details (order, trade return, ticket number, open price, close price, open timestamp, close timestamp, currency pair, position size) from backtests or live trading to ...
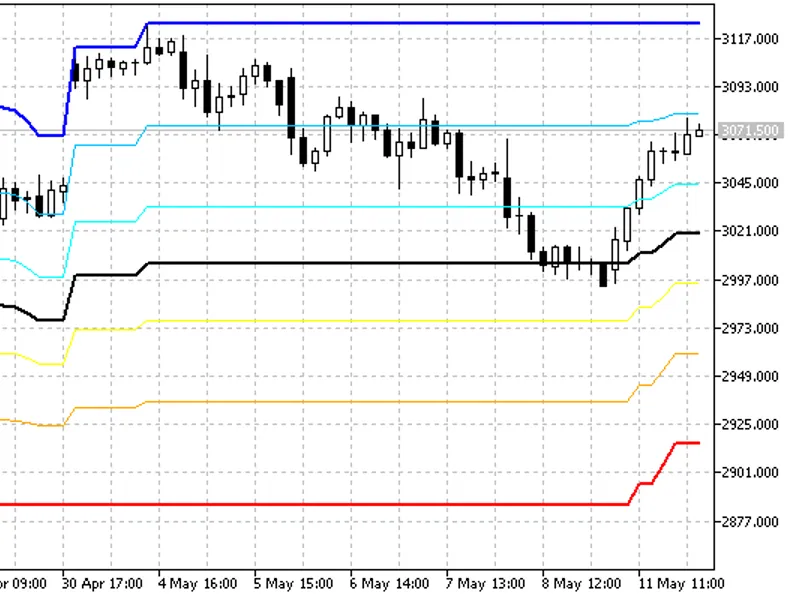
This indicator combines the Donchian Channel and Fibonacci Retracements to provide a comprehensive view of price action and potential support/resistance levels.The Donchian Channel...
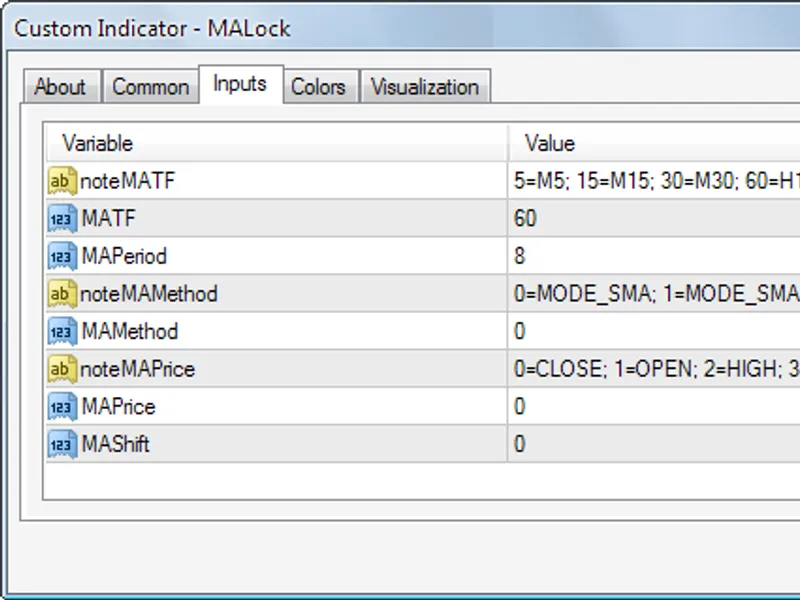
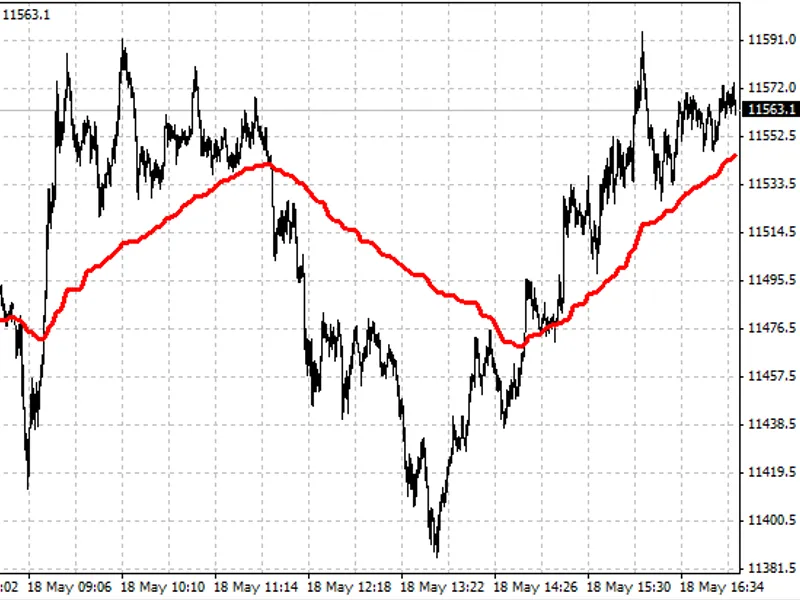
This indicator is designed to define a Moving Average (MA) for a specific timeframe and automatically adjust its settings when switching timeframes.The concept is to view the MA of...
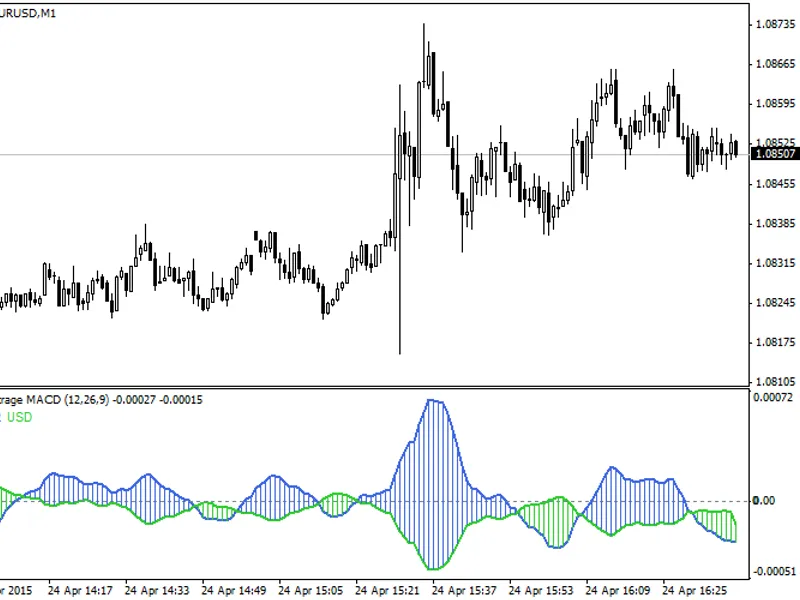
This indicator displays OHLC (Open, High, Low, Close) colour candles in a separate window for the following indicators:- Moving Average Convergence/Divergence (MACD)- Stochastic Os...
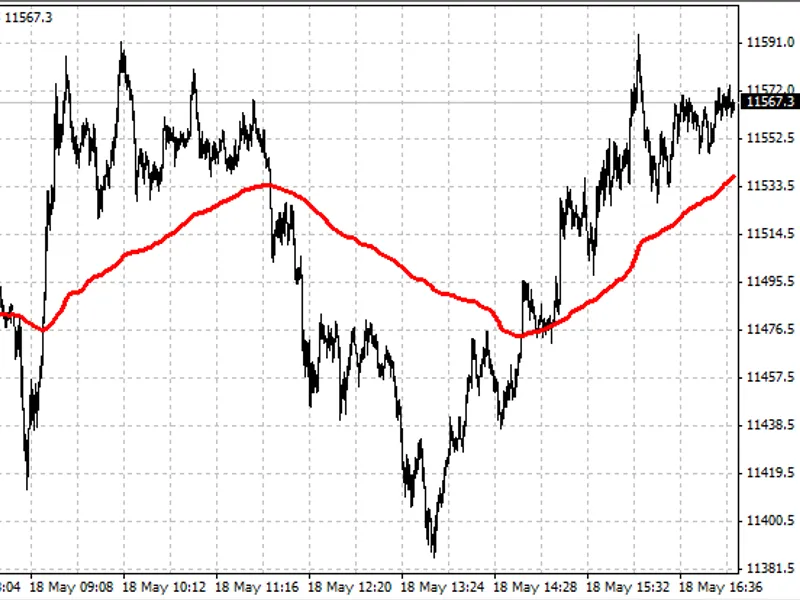
This indicator estimates the real market value, aiming to provide a slower-moving alternative to the market price with better fitting than a moving average.The indicator's movement...
The Real Value Extended indicator is designed to provide a smoother representation of market price movements, offering a unique alternative to the traditional moving average.This i...
This indicator helps you identify the currently active chart.The code is compatible with both MT4 and MT5 platforms. For MT4, simply change the file extension to .mq4....
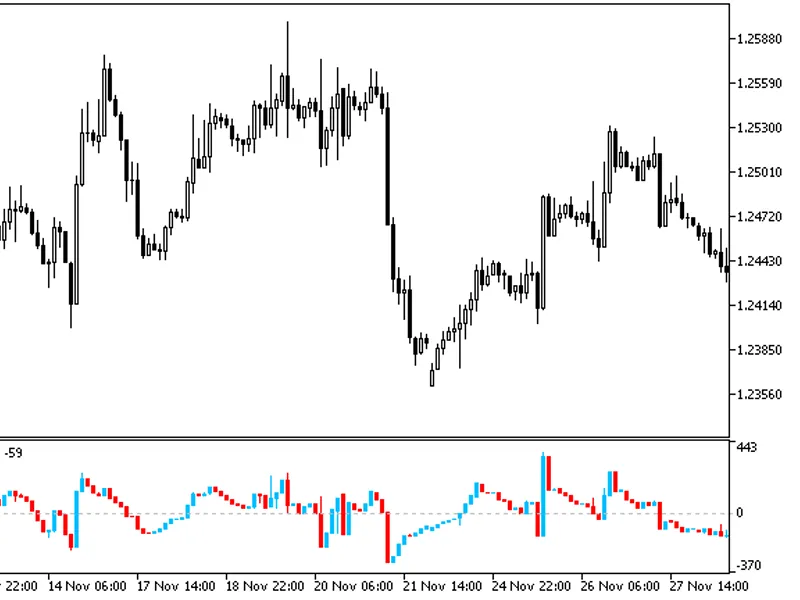
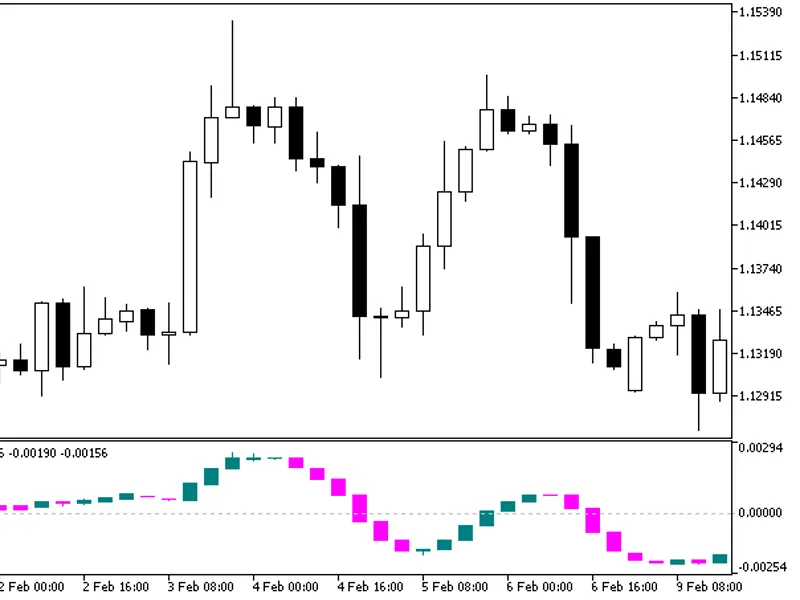
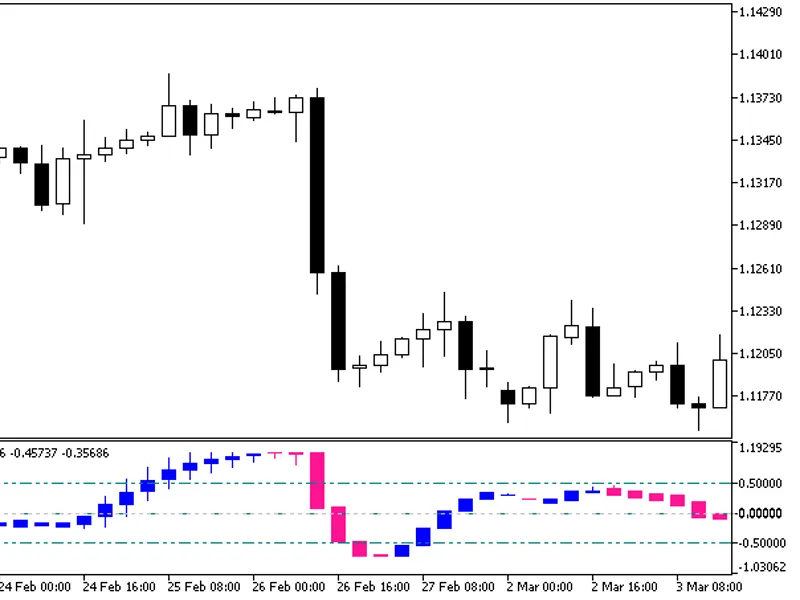
The Commodity Channel Index (CCI) indicator is presented as a sequence of candlesticks, offering a unique visual representation of price data. Candlesticks are formed by applying t...
This indicator presents a unique visualization of price data by transforming it into a sequence of candlesticks.The candlesticks are generated through the application of a momentum...
The OSMA indicator is implemented as a sequence of candlesticks, providing a unique visual representation of price data. Candlesticks are formed by applying the OSMA algorithm to r...
The JC C X Candle indicator is a unique tool that displays a sequence of candlesticks, offering a fresh perspective on price analysis.This indicator processes relevant price time s...
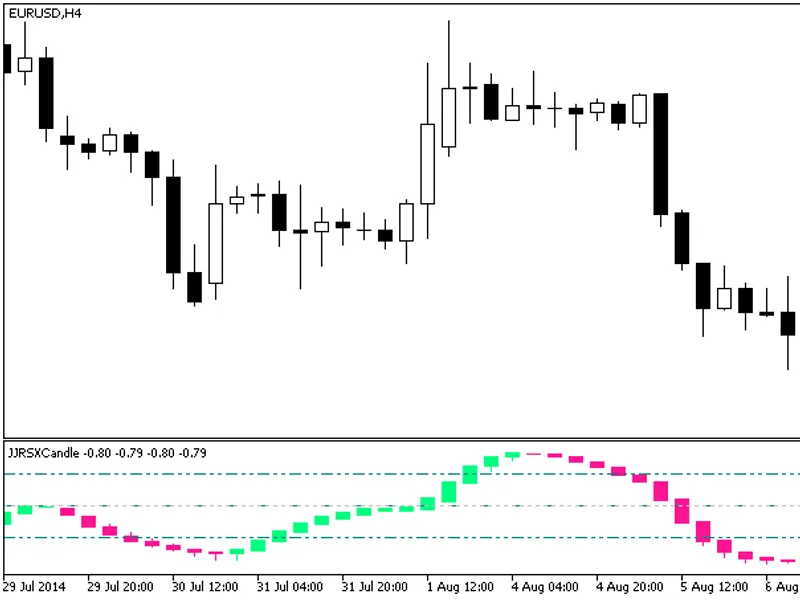
The JJRSX Candle indicator is a powerful tool for traders, offering a unique perspective on price action. It presents a sequence of candlesticks derived from the JJRSX algorithm's ...
The TEMA (Triple Exponential Moving Average) indicator is presented as a sequence of candlesticks, offering a unique perspective on price analysis.These candlesticks are derived fr...
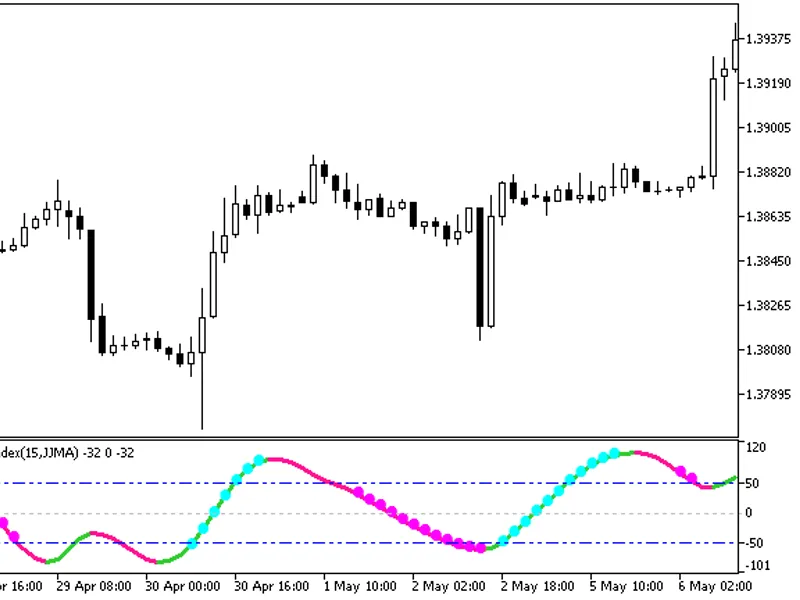
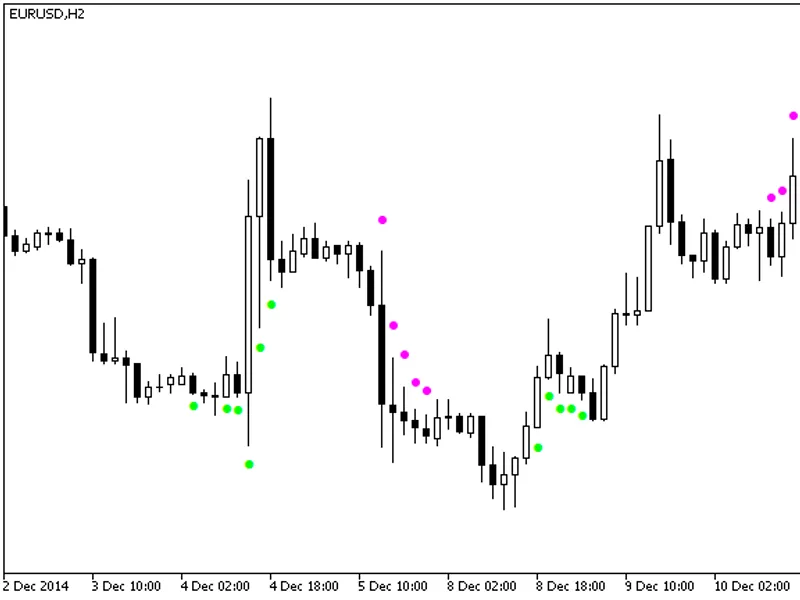
The indicator provides additional trend strength indication using colored dots based on the standard deviation algorithm.When the standard deviation of the XXRSX indicator exceeds ...
The indicator provides additional trend strength indication through colored dots, utilizing the standard deviation algorithm.When the standard deviation of the ColorJfatl indicator...
This indicator is based on the XCCX oscillator and its standard deviation.Depending on the mode input parameter, the indicator employs one of five methods to determine signals:Leve...
This indicator is based on the XXRSX oscillator and its standard deviation. It provides trading signals by analyzing the oscillator's behavior and deviation from specified levels.T...
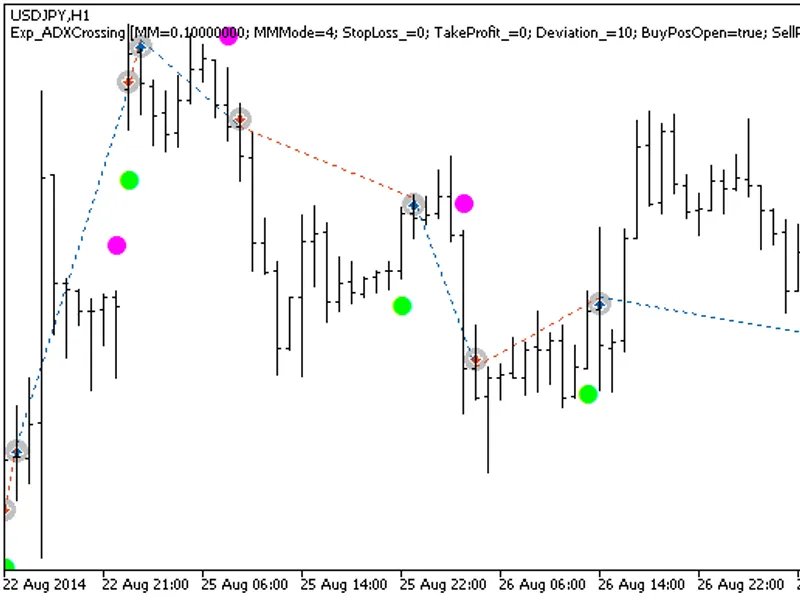
This Expert Advisor (EA) is a trading system that utilizes the ADX Crossing indicator. It makes trade decisions based on the appearance of colored indicator dots.To run this EA, yo...
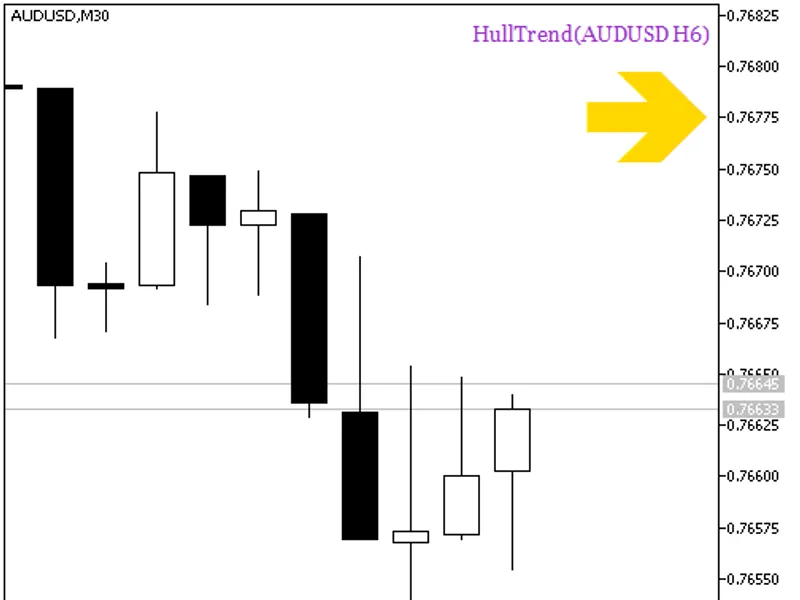
The Hull Trend HTF Signal indicator displays trend direction or signals generated by the indicator at a chosen bar. It uses a colored graphical object to show trend indication or d...
This indicator displays a sequence of candlesticks generated by applying the Laguerre algorithm to the price time series. This method can offer more informative analysis in various...
JFATL Sign Indicator
This indicator provides signals based on the direction change of an average.It utilizes classes from the smoothalgorithms.mqh library. Ensure this library is ...
Hull Moving Average (HMA) Indicator with Enhanced Trend Strength Indication using Colored Dots based on Standard Deviation.This indicator visualizes trend strength through colored ...
Ozymandias Lite is a streamlined version of the Ozymandias indicator.This edition focuses on core functionality by removing the price band lines and the Average True Range (ATR) in...