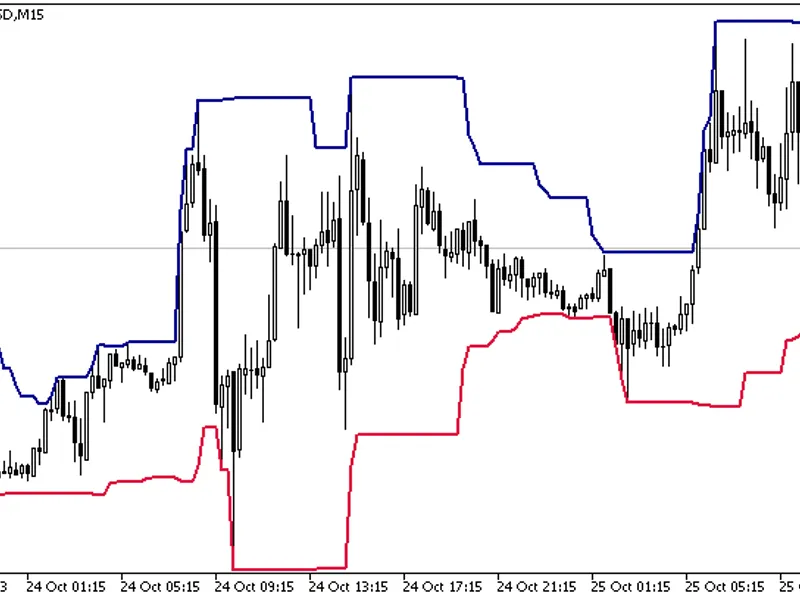
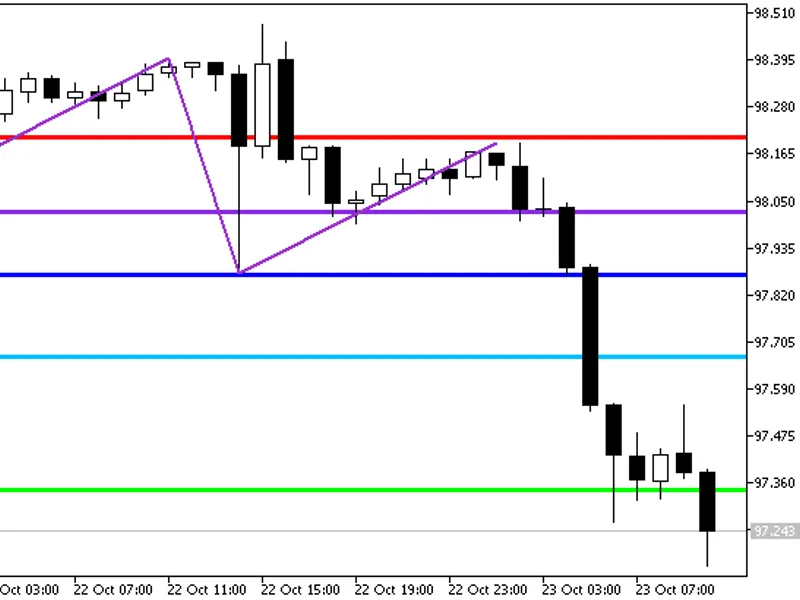
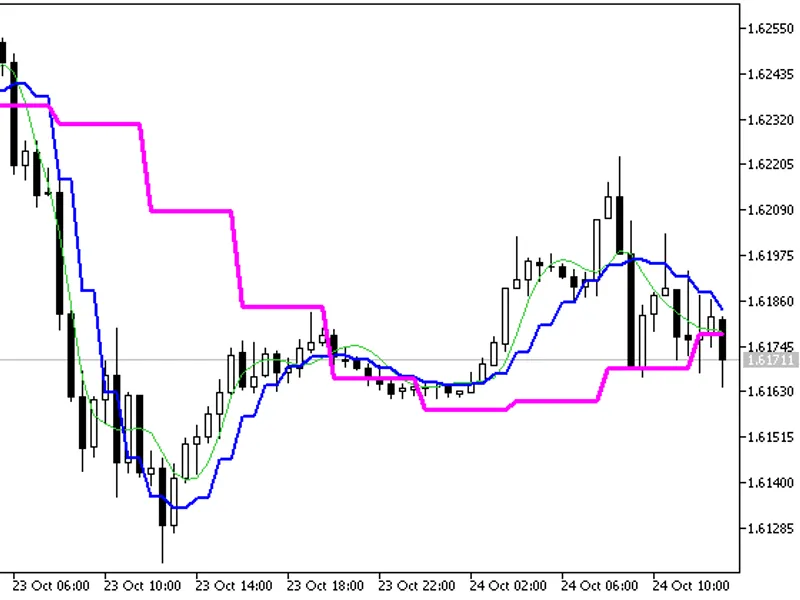
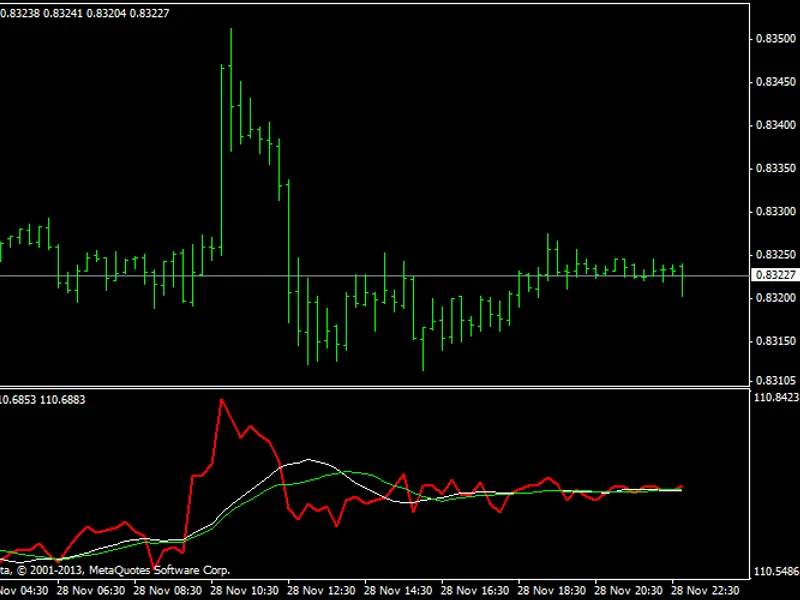
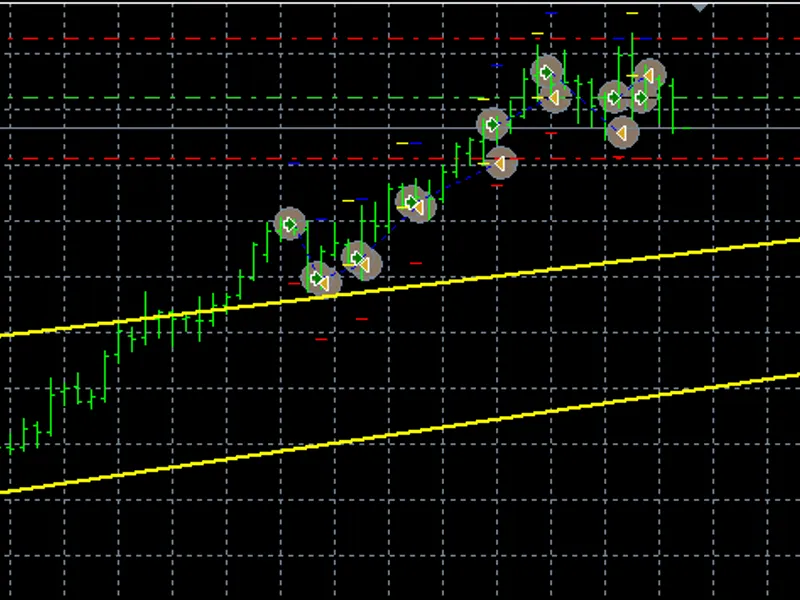
Donchian Channel is a volatility indicator based on the calculation of the current price range with the recent highest and lowest prices.Key Features- The indicator calculates the ...
An example of a multicurrency expert advisor that uses a loop, where each iteration is responsible for trading each symbol separately.To avoid dependence on ticks of any symbol, th...
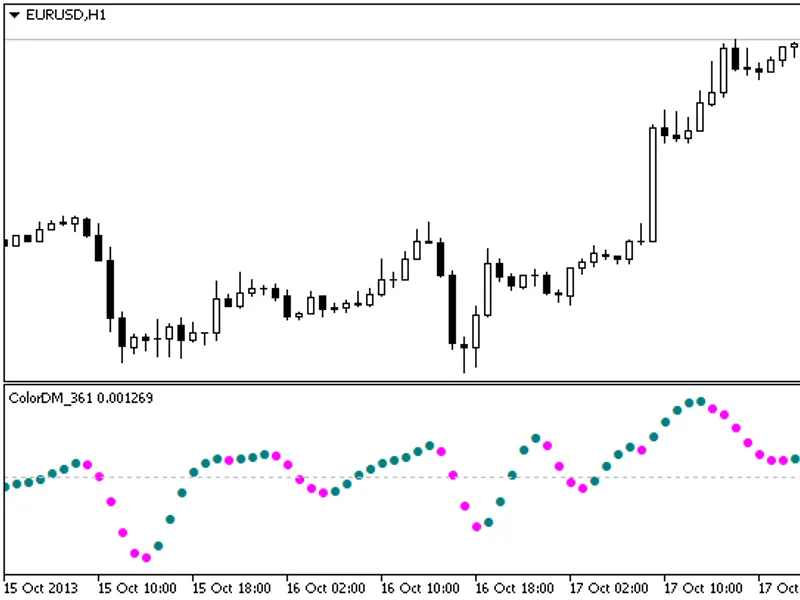
Finware.ru Ltd.A digital momentum indicator represented by colored characters.This indicator was first implemented in MQL4 and published on 11.02.2026.Figure 1. The ColorDM_361 Ind...
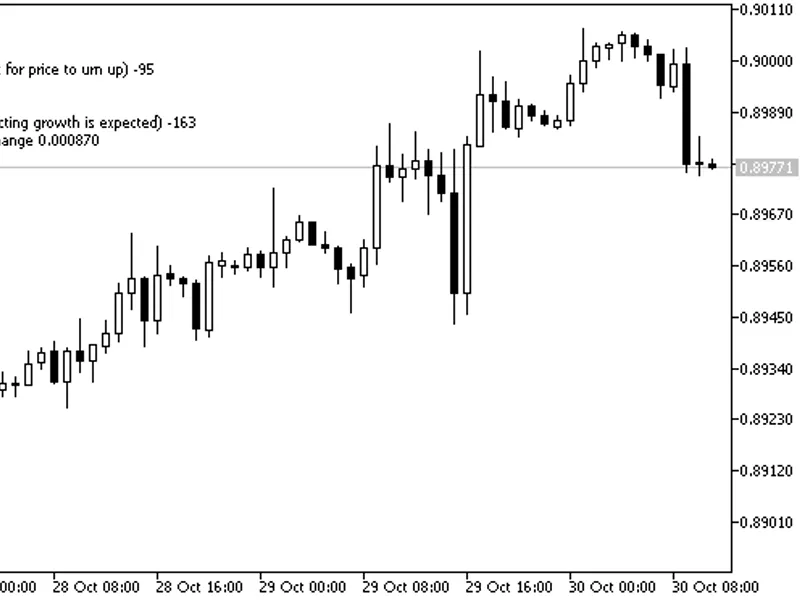
The Commentator Indicator analyzes a group of technical indicators and displays trade recommendations.This indicator was first implemented in MQL4 and published on 11.02.2026.Figur...
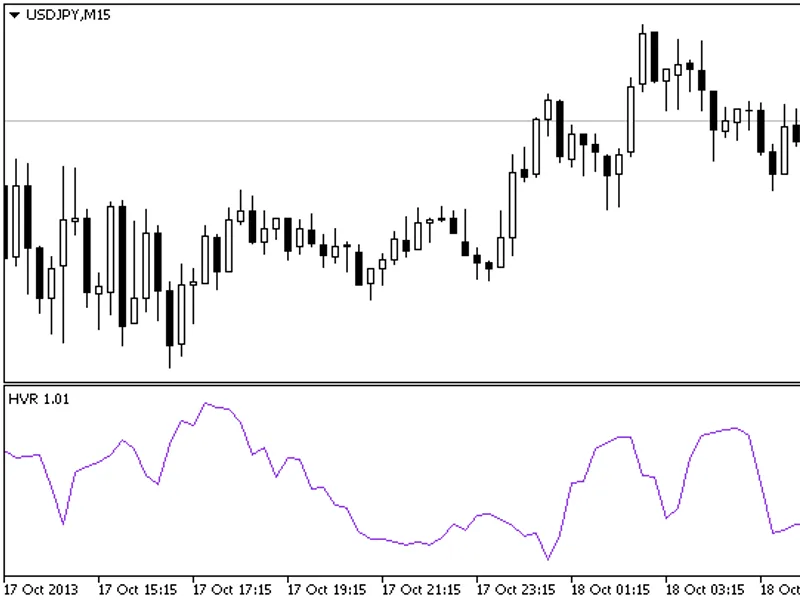
HVR IndicatorAn indicator of trend strength. The ratio of the price of the current bar to the price of the previous bar is used as the initial data for the calculation.This indicat...
I-Pass Lev CCI Indicator
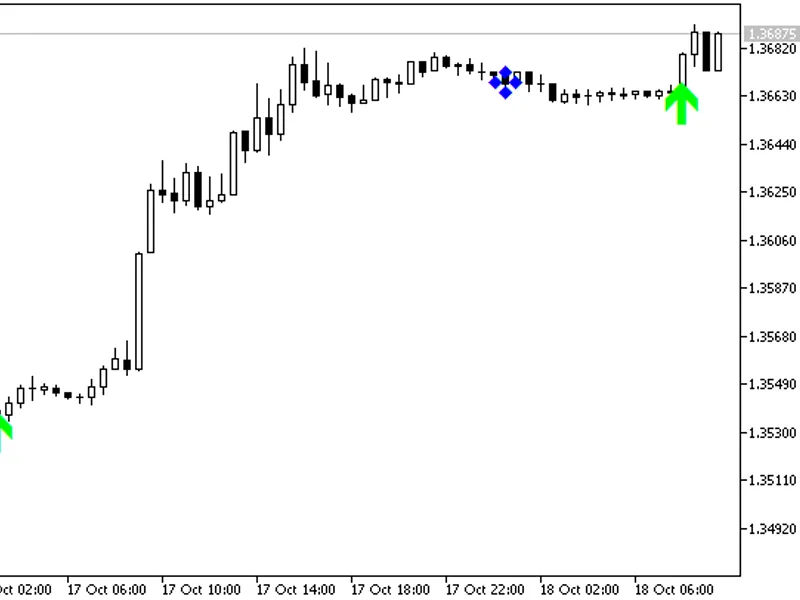
This indicator provides semaphore signals using an oscillator.
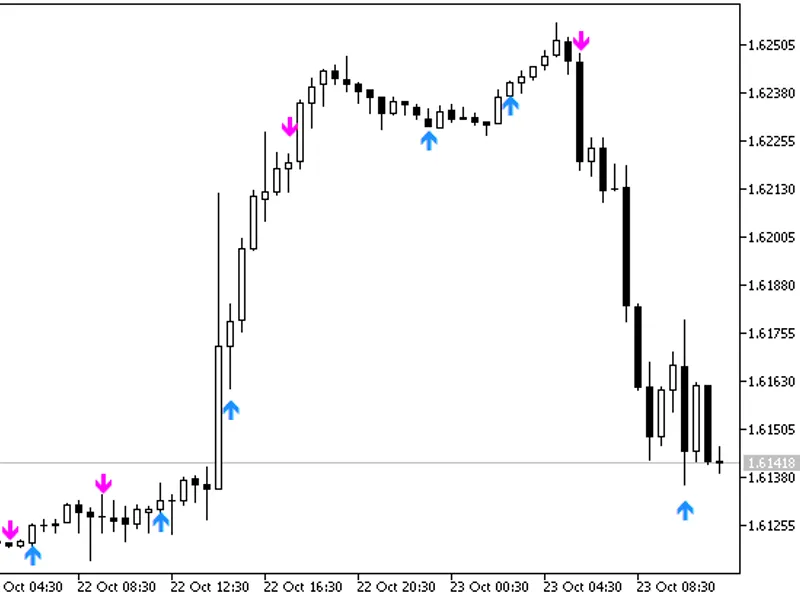
Entry signals are displayed on the chart as colored arrows.
Exit signals are indicated by...
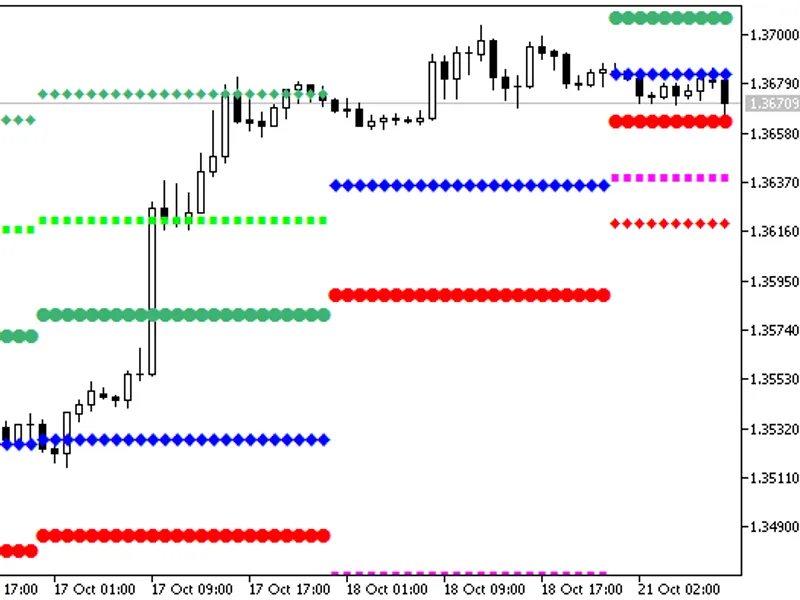
The indicator displays support and resistance levels calculated on daily prices. Support and resistance levels are calculated by the following formulas:This indicator was first imp...
The NRTR Indicator using Technical Analysis.This indicator was first implemented in MQL4 and published on 26.02.2026.Figure 1: The BAT_ATRV1 Indicator...
i-sk b-f IndicatorBarishpolts' moving channels indicator.This indicator was first implemented in MQL4 and published on 09.02.2026.Figure 1. The i-skb-f indicator....
This is a basic script designed to upload any open and pending trades to a web server.The accompanying zip file includes examples in PHP and MySQL for data saving and verification....
This indicator displays the remaining time for the current candle on your chart.It provides a clear visual representation of how much time is left before the current candlestick cl...
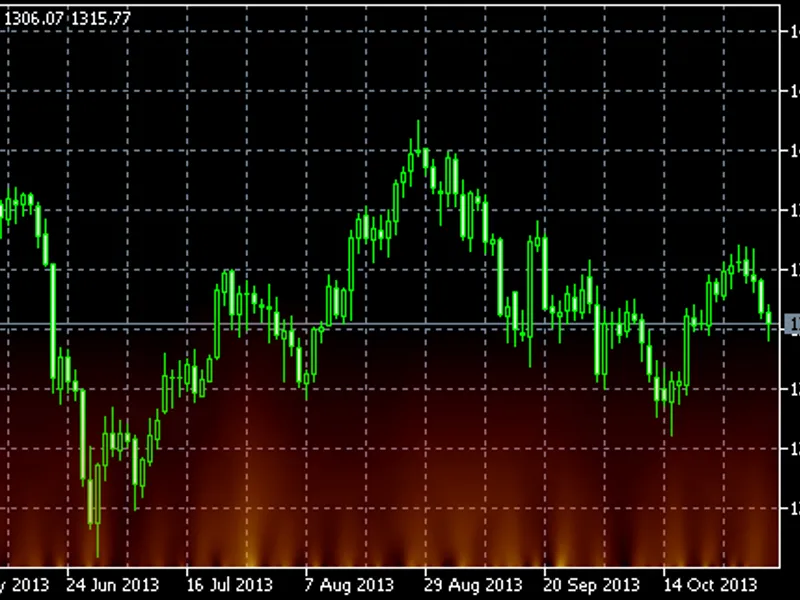
The Flame indicator displays gradient semitransparent areas with an independent update rate.This feature allows for dynamic and visually distinct representations of data within the...
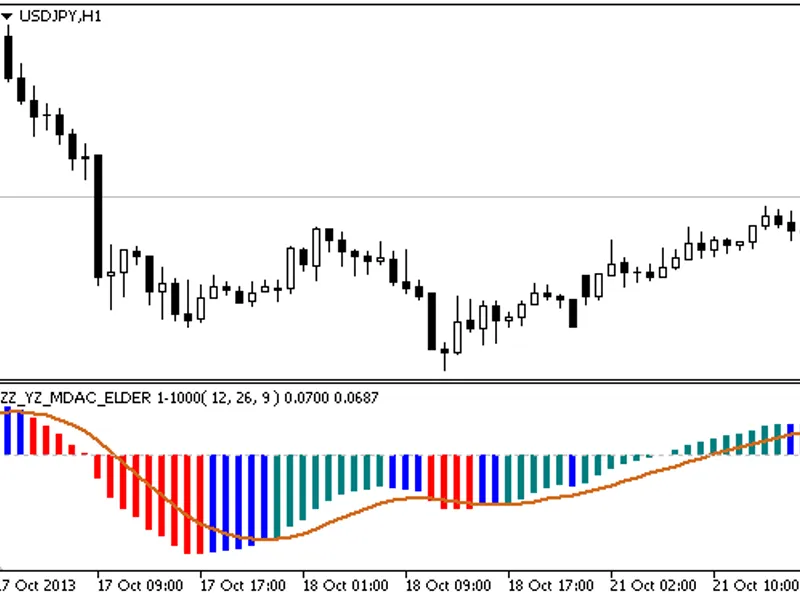
MDAC Indicator with Bar Coloring According to ElderGreen Bars: UptrendBlue Bars (Following Green or Red Bars): Trend ChangeRed Bars: DowntrendThe indicator utilizes the smoothalgor...
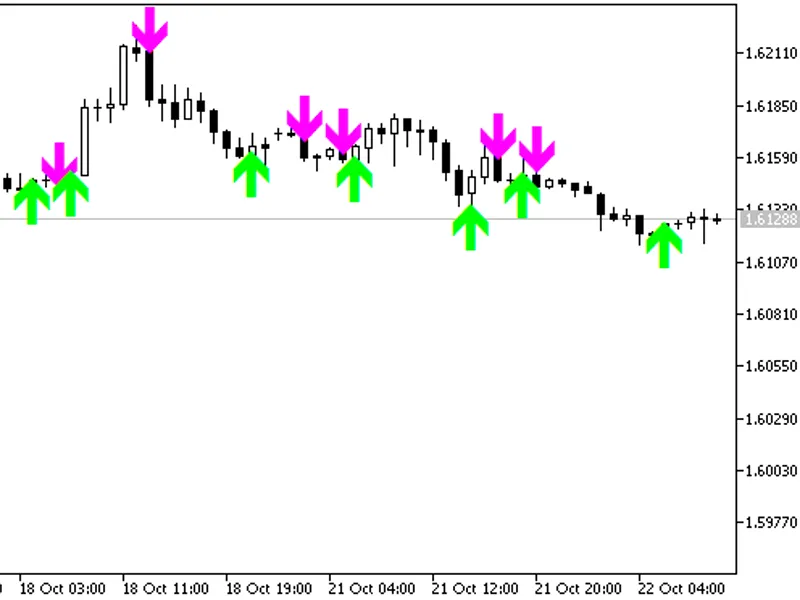
Semaphore Arrow Indicator Using Two Moving AveragesThis indicator generates signals at the crossing point of two Moving Averages (MAs). An additional filter for signal generation i...
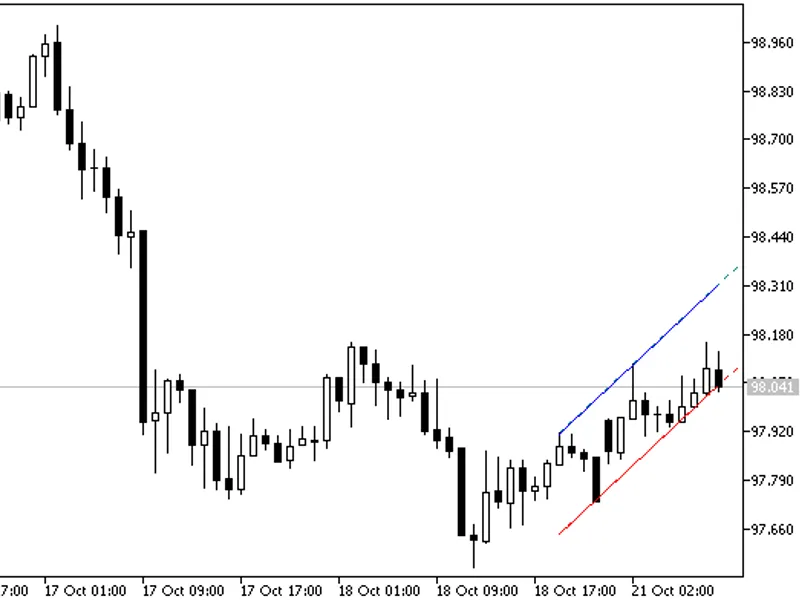
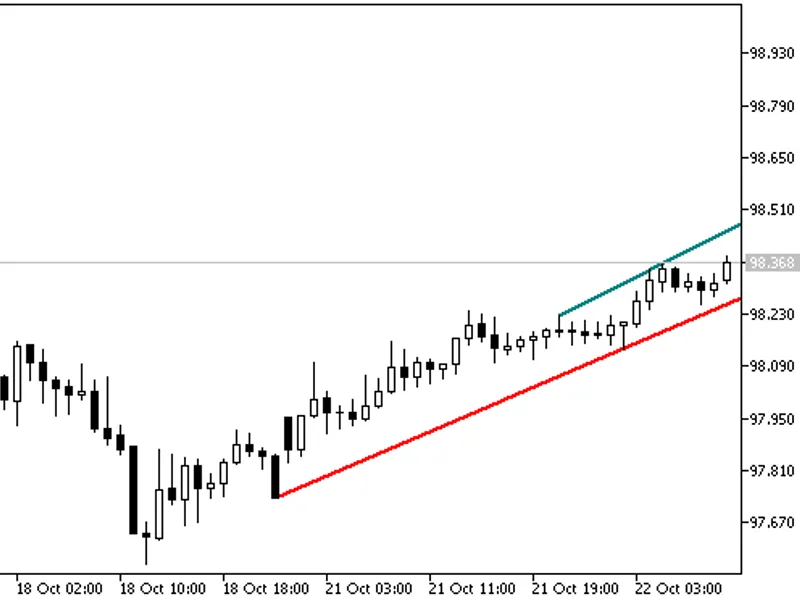
Trendlines Day
This indicator draws trend support and resistance lines.
This indicator was first implemented in MQL4 and published on 28.03.2026.
The Trendlines Day indicator...
Di Napoli Levels Indicator with AlertsThis indicator displays Di Napoli levels on the current chart, complete with alerts.The indicator was first implemented in MQL4 and published ...
Fast3
This is a semaphore signal indicator. Its signals are calculated similarly to the standard indicator, but trade signals are displayed directly on the chart as corresponding ...
The Fast 2 indicator analyzes the latest three bars using a quadratic function, displayed as a histogram with two signal lines of different periods. Enter the market at the interse...
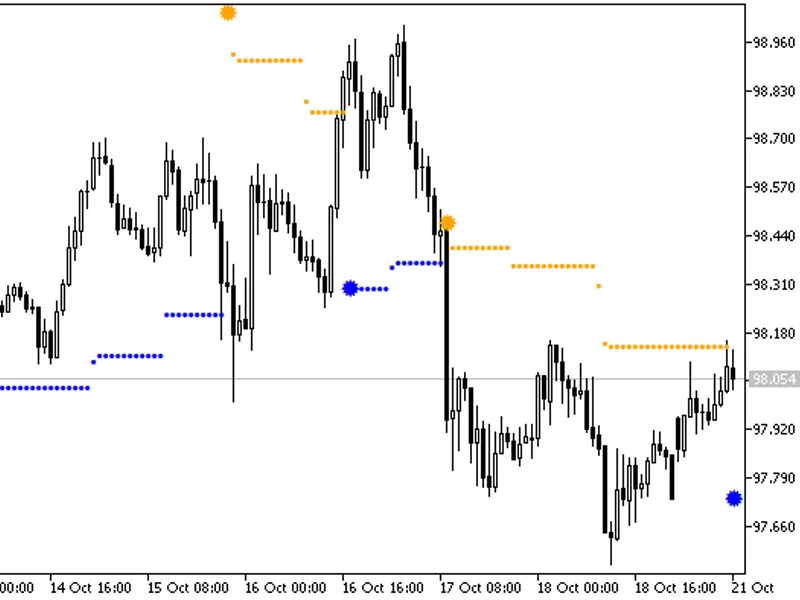
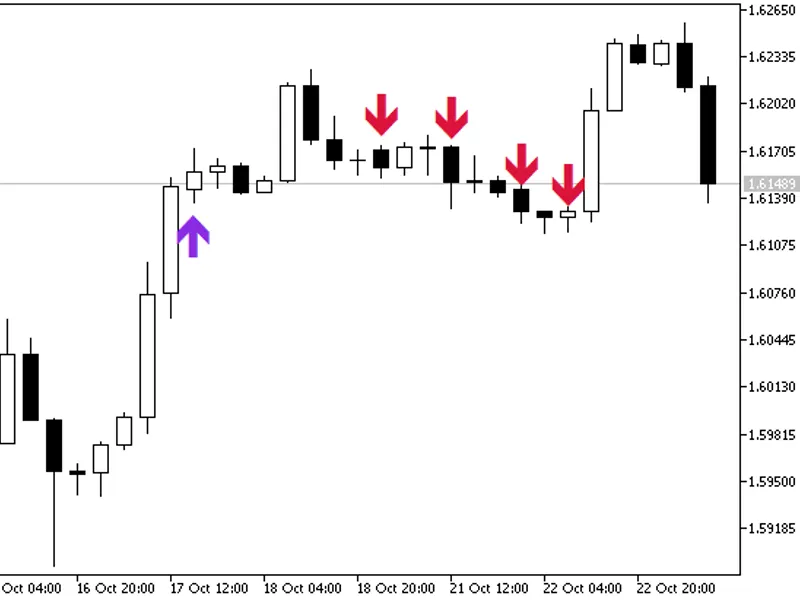
A semaphore signal indicator that forms signals when price gaps appear.This indicator was first implemented in MQL4 and published on 09.02.2026.The i-Gap IndicatorThe indicator gen...
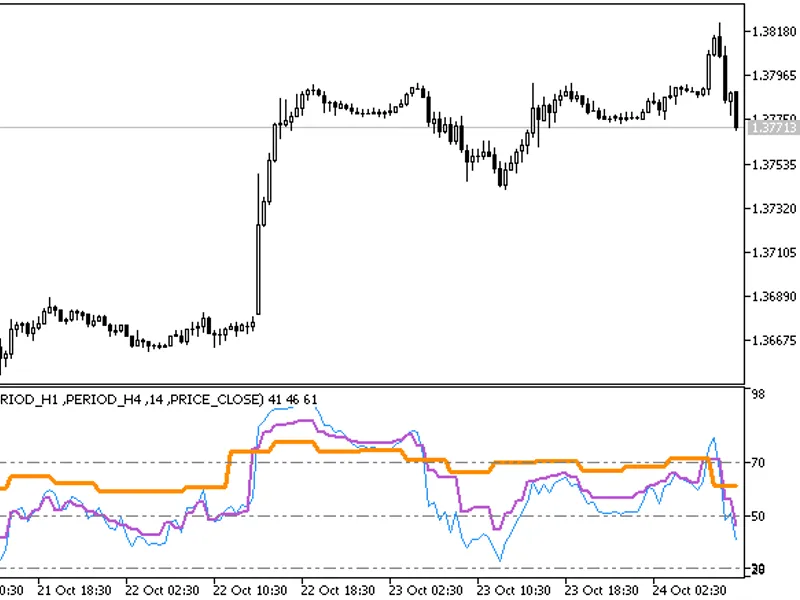
The RSI 3-Timeframe indicator displays three RSI oscillators on a single chart, each utilizing a different timeframe.RSI 3-Timeframe Indicator- Displays three RSI oscillators.- Eac...
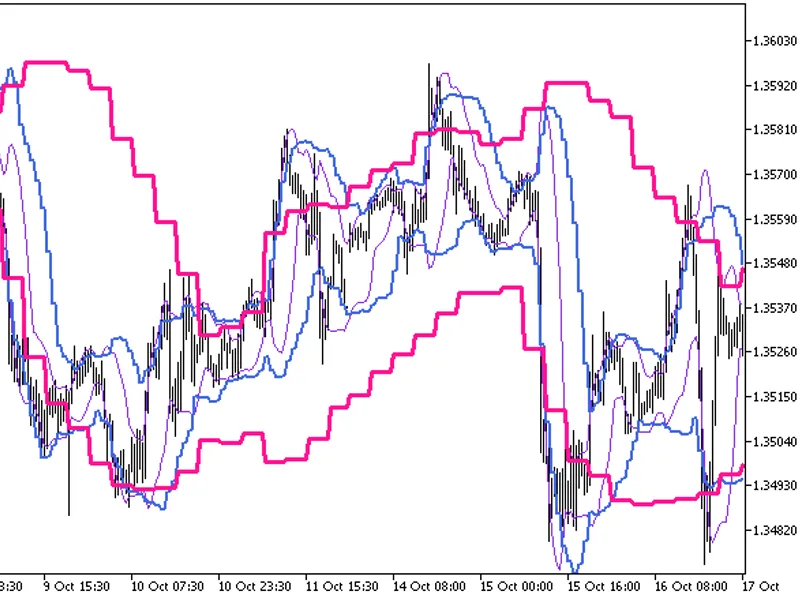
Bollinger Bands 3 Timeframe Indicator displays three sets of Bollinger Bands on a single chart, each utilizing different timeframes but maintaining identical parameters.This indica...
Tick Volume Indicator
This indicator utilizes tick volume for its calculations. In futures markets, trade volume data is reported with a one-day delay. To address this, many analy...
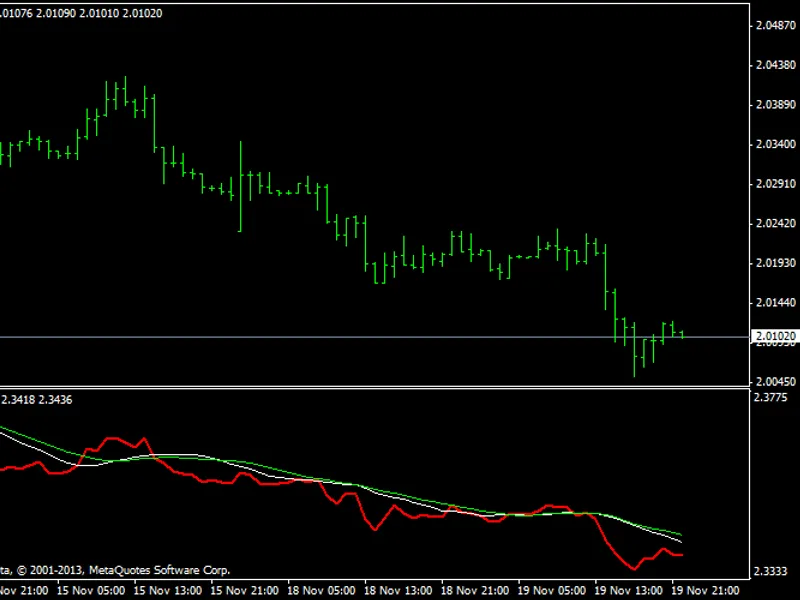
This indicator features three smooth and fast digital filters with three different timeframes displayed on the same chart.Installation InstructionsTo use the indicator, place the c...
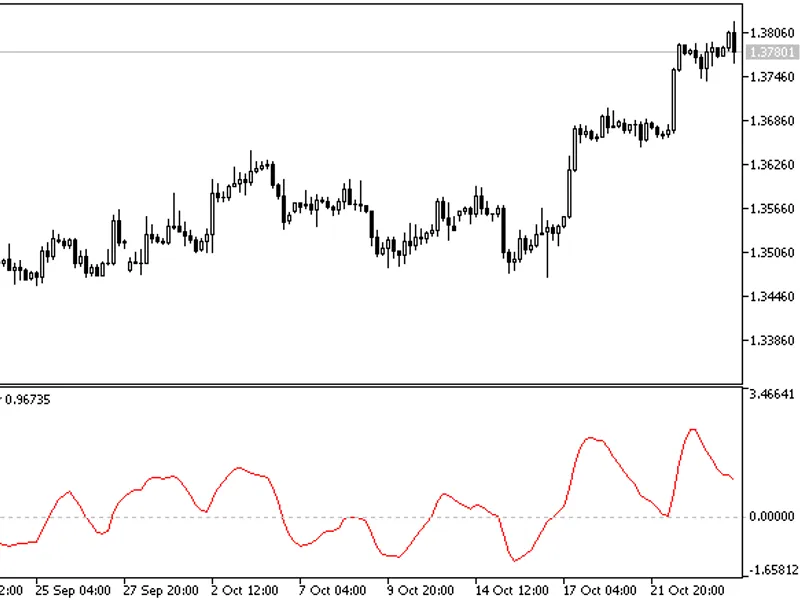
This is the Ergodic Ticks Volume Indicator.Indicator DescriptionThe Ergodic Ticks Volume Indicator is one of the indicators of tick volume with multiple EMAs.The indicator uses Smo...
Candle Closing Time Remaining (CCTR) is an indicator that displays the remaining time for an open candle to be closed.Features- Changeable color and size.- Changeable location (cor...
Currency IndexTurkish Lira Index (Sepet Kur)The Trybask index is calculated as 1 x [(USDTry x 0.50) + (EURTry x 0.50)].The presented indicator is displayed in the form of a line wi...
Unseasonalised Average Trading Range and Forecast for Monthly ChartsThis Expert Advisor is best used on monthly candlestick charts with four decimal points to a pip (use the JPY ve...
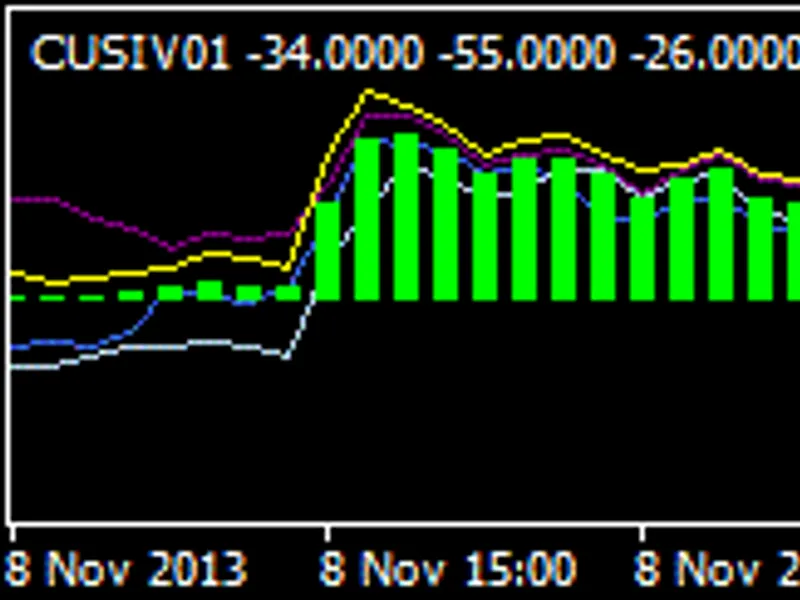
Coensio USD Strength Indicator (CUSIV01) measures the momentary USD strength, using combined data from the following four USD pairs: EURUSD, GBPUSD, AUDUSD, and USDJPY.The USD mome...
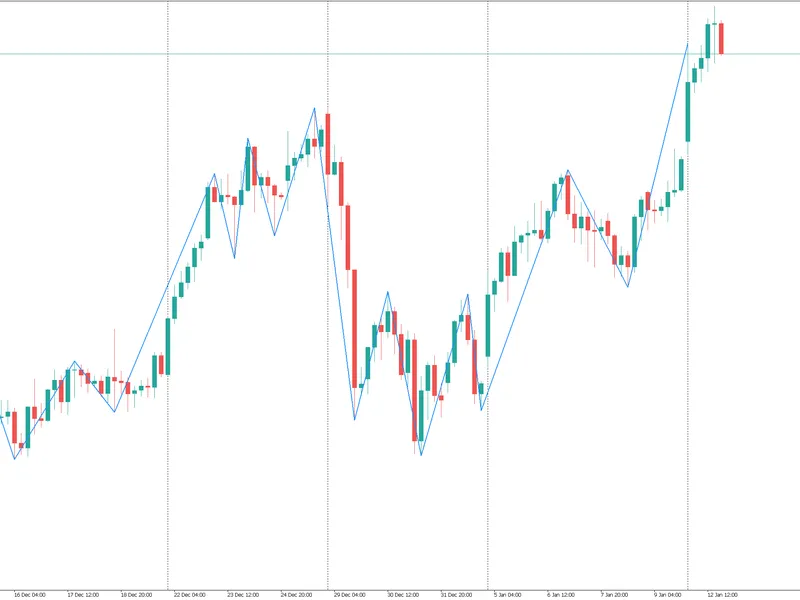
Adaptive Structure Zig Zag is a modern evolution of the classic fractal principle. The story behind Adaptive Structure Zig Zag began as a research experiment with a simple question...
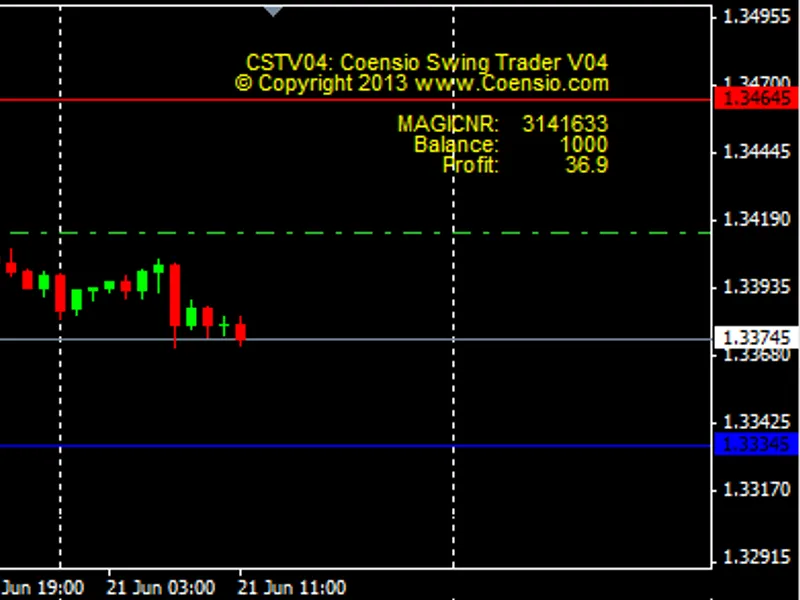
Coensio Swing Trader makes it possible to trade semi-automatically using manually pre-defined support/resistance or breakout levels. The EA sends orders automatically according to ...
EURX Euro Currency IndexThe EURX Euro Currency Index is calculated using the following formula: eurx = 34.38805726 x [(eurusd x 0.3155) + (eurgbp x 0.3056) + (eurjpy x 0.1891) + (e...
This Expert Advisor incorporates money management and signal selection capabilities.Users can easily integrate their custom signals by modifying the signal function. The included Z...
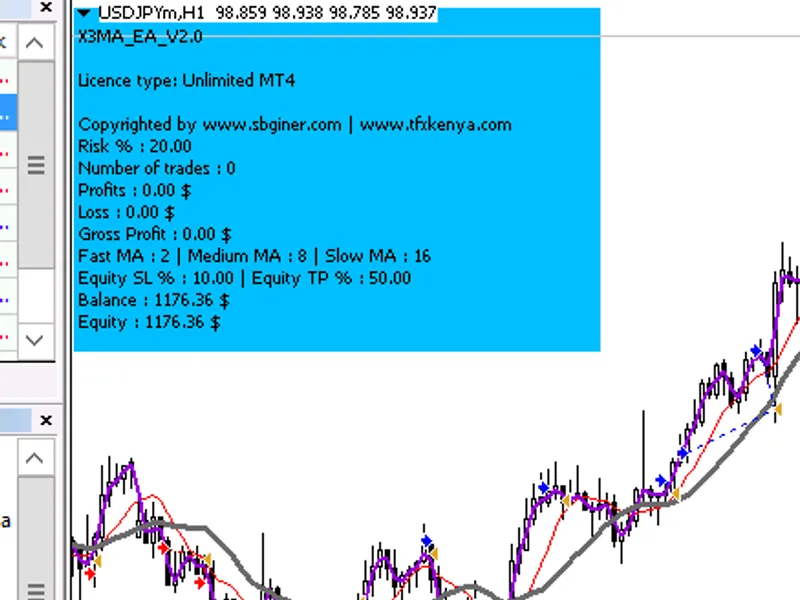
The X3MA Expert Advisor utilizes three fast Moving Averages (MAs) to identify entry and exit points, particularly during crossover events.This EA is compatible with all brokers and...
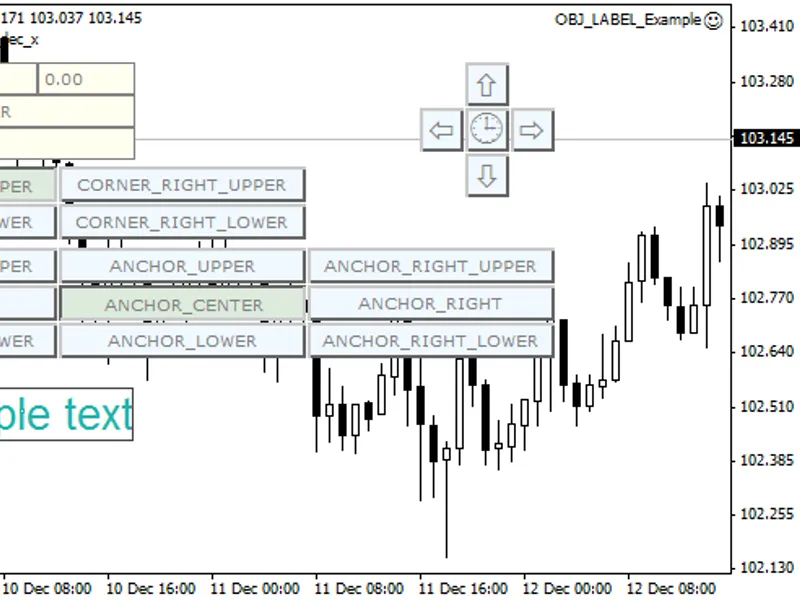
Description:This Expert Advisor demonstrates the usage of the OBJ_LABEL graphic object.The EA is coded in MQL5 style. Graphic object properties such as coordinates, angle, corner, ...
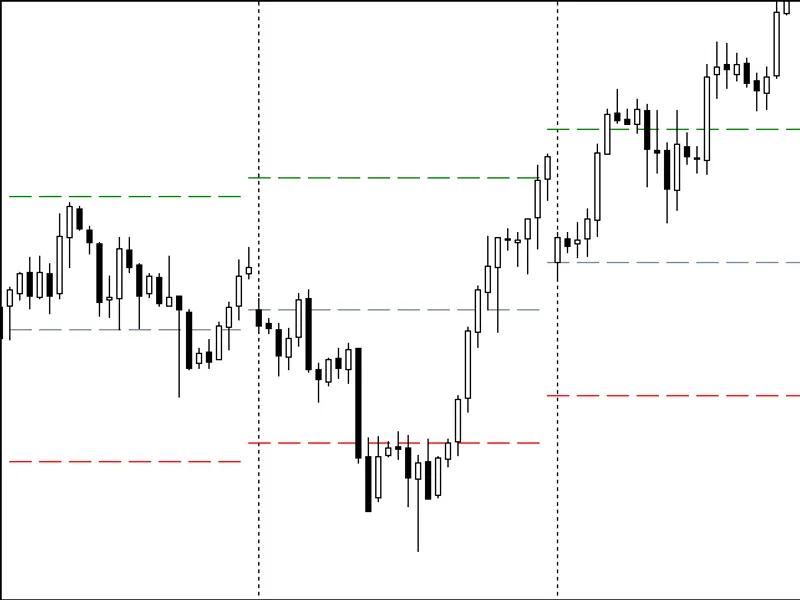
This indicator provides horizontal lines for the weekly open price and potential target levels.It includes two variations:1. Weekly Open + Targets: Displays a horizontal line at th...
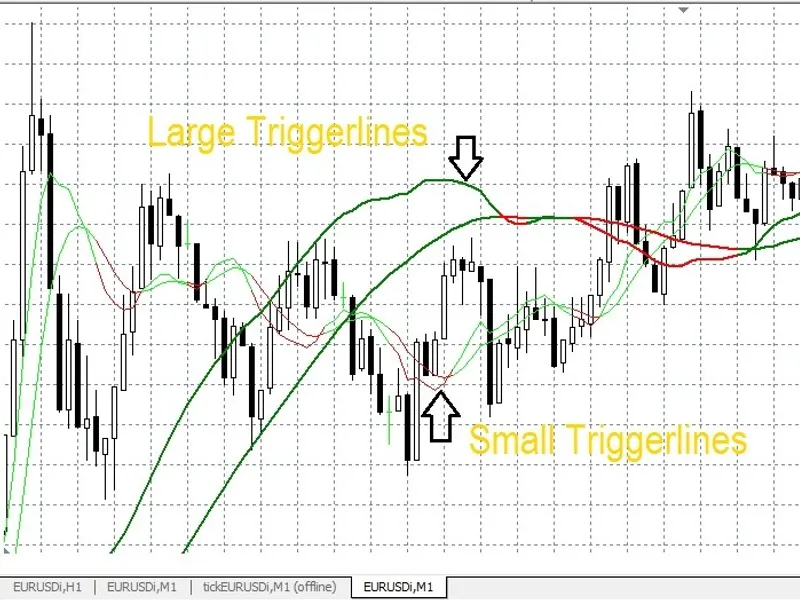
Trigger Lines IndicatorThis indicator is designed to be used alongside your existing trading strategy. The trigger lines provide information on market direction.The large trigger l...
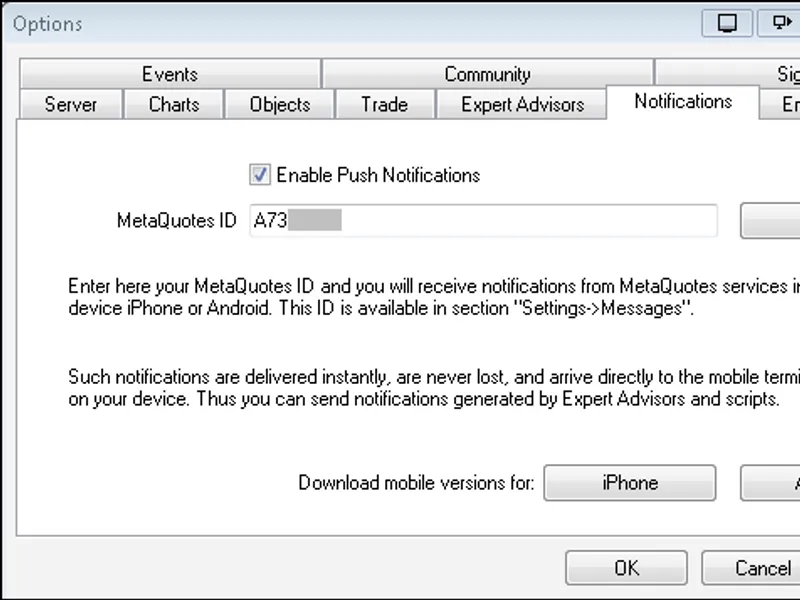
indicator: alerts on new baralert options:popup alertsound alertemail alertpush notificationNote: If popup alert and sound alert are both set to true, only the popup alert will fun...
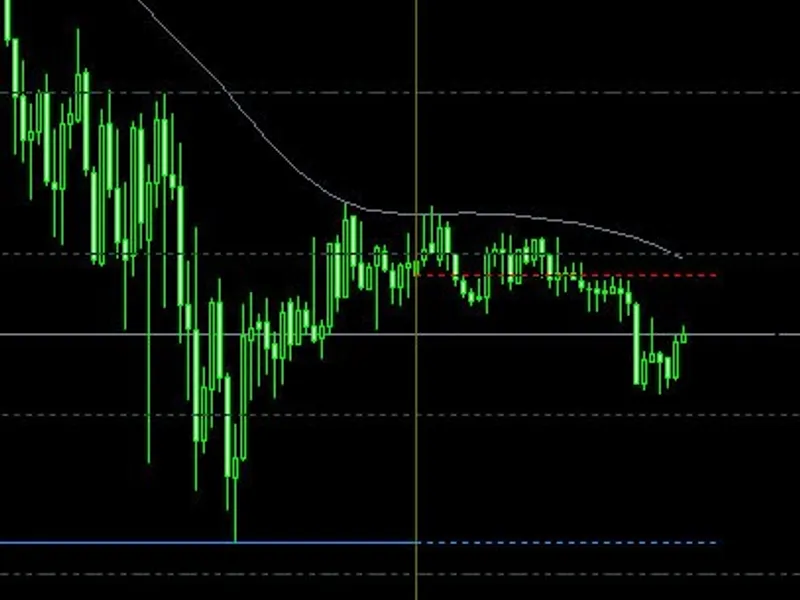
This indicator displays the distance to assumed stop levels using two lines positioned at a predetermined distance from the current price. Despite its simplicity, it is a very usef...
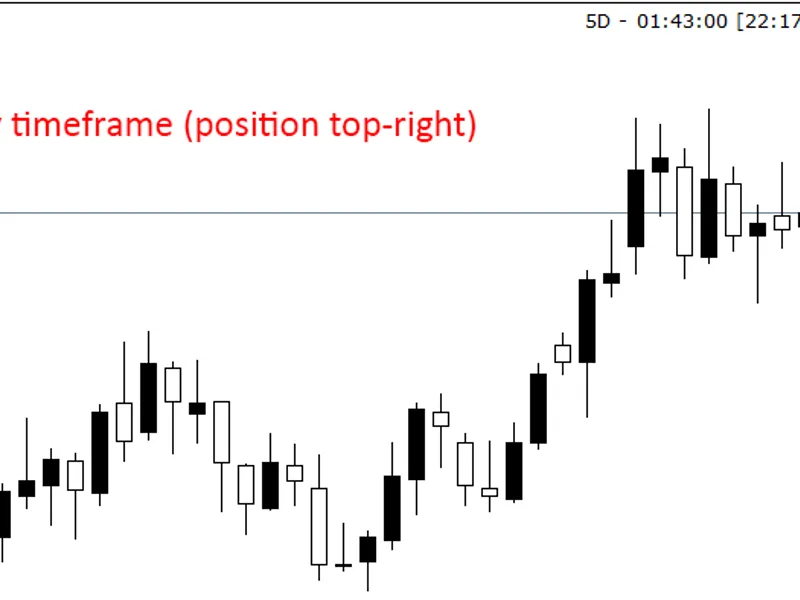
Displays the chart's symbol and period label.Allows customization of text size, color, and position on the chart.Supports non-standard periods up to 59 minutes, ideal for offline c...
Catcher Profit EA is an Expert Advisor designed to monitor and manage trade profitability on your MetaTrader graph.The EA continuously checks the current profit and loss (P/L) valu...
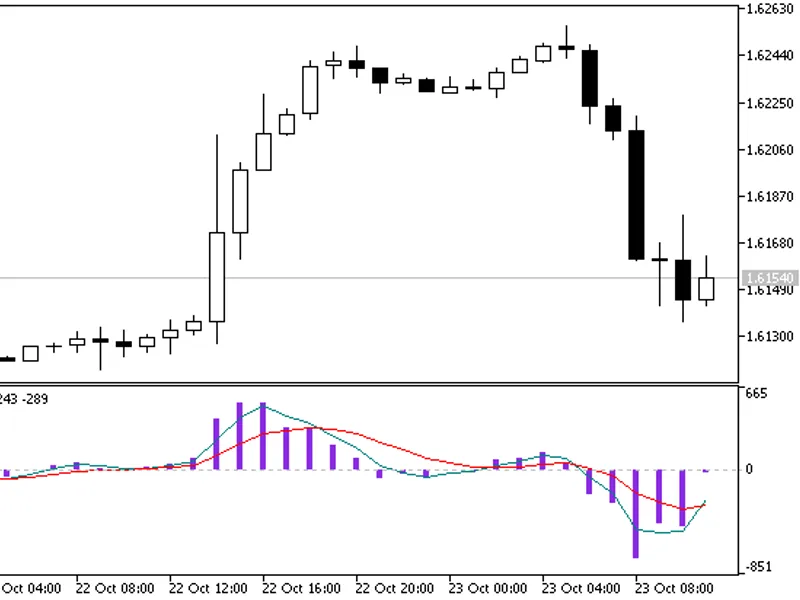
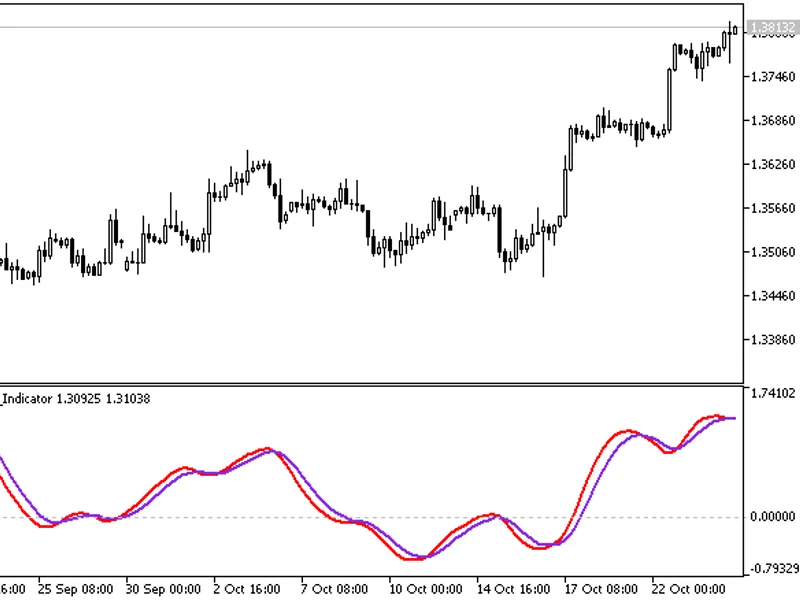
A normalized oscillator consisting of two curves, functionally similar to the standard oscillator indicator.The indicator's logic operates as follows: when the blue line is above t...
Simple scripts to draw weekly and monthly pivot points, including support and resistance lines for the current week or month.Recommendations:- Accompany submitted code with a meani...
This Expert Advisor demonstrates the use of the OBJ_LABEL graphic object.The EA is coded in MQL5 style, and the properties of the graphic object, including coordinates, corner, and...
The Time Indicator displays both the broker's time and the local computer's time directly on your trading chart.The display size can be adjusted using the zoom level setting.You ca...
The ergodic Blau CM indicator, implemented as a colored histogram.The indicator uses classes from the smoothalgorithms.mqh library (must be copied to the terminal_data_folder\mql5\...
This indicator is based on the concepts presented in the book "Momentum, Direction, and Divergence" by William Blau.It visually represents momentum through color signals and a colo...