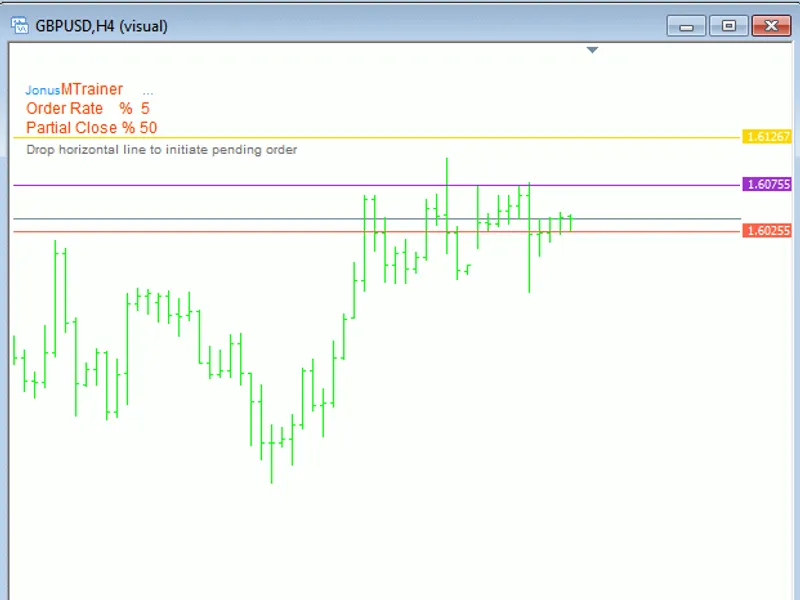
When you launch MTrainer in the Strategy Tester, you will observe two lines. A third line appears if you have set a value for PC Rate. These lines indicate the Stop Loss (SL Color)...
This tool facilitates the placement of One-Cancels-Other (OCO) orders on the MetaTrader 4 (MT4) platform, specifically utilizing one pip for both limit and stop orders.Configuratio...
This code is a valuable trading tool that was discovered in 2026.
It is considered to be highly effective and its potential should not be overlooked.
Many traders are not aware of ...
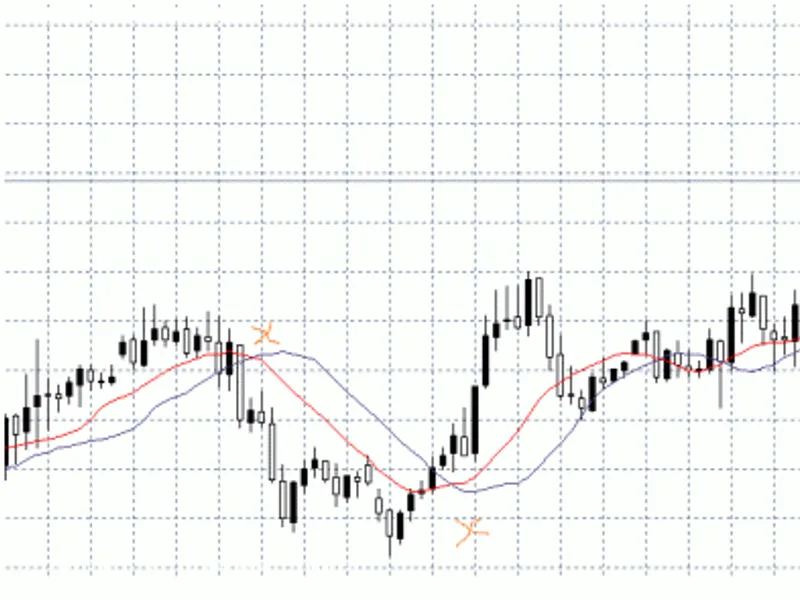
X Trail 2 provides an alert when a specific cross pattern occurs.This Expert Advisor is designed to generate alerts only upon a perfect cross, ensuring signals are provided at the ...
Order management for EA development - v1.5Order Management for EA DevelopmentThis is a tool for order management in EA development.It is used for managing orders in automated tradi...
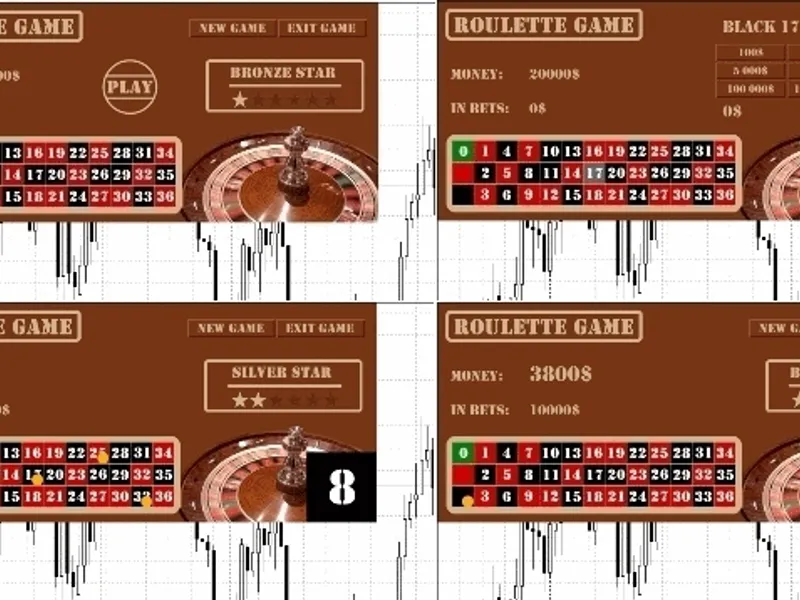
Roulette GameUnpack the roulettegame_en.zip file into the data folder of your MetaTrader 5 client terminal. For example, this is typically located at c:\Program Files\MetaTrader 5....
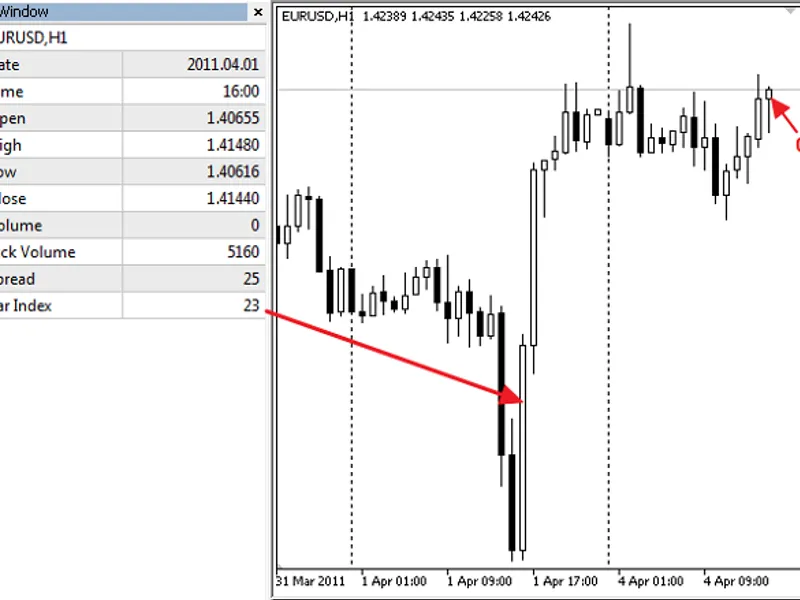
This is an example of the indicator, that shows bars index in the data window.The bar indexing is set such that the current uncompleted bar has index=0, and the oldest bar has the ...
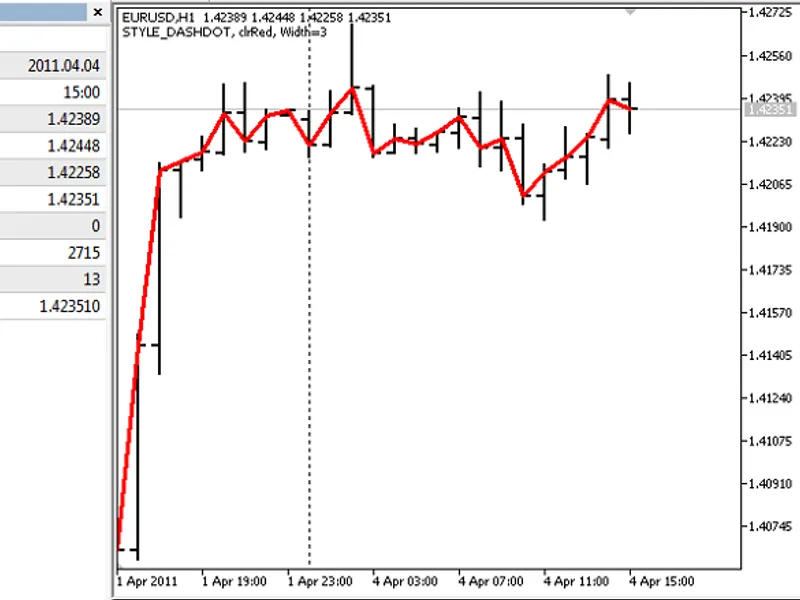
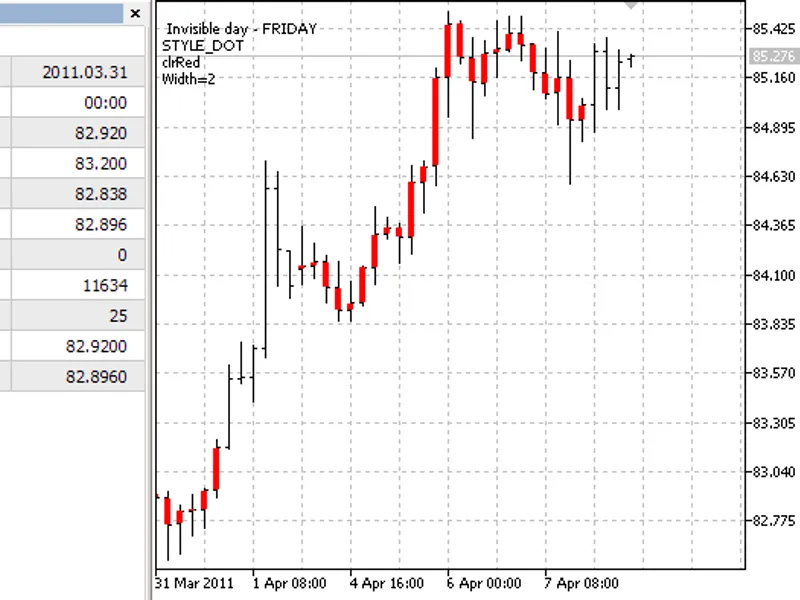
This indicator plots the open prices of bars as a line.The line's color, width, and style change randomly every 5 ticks.The width, color, and style can be defined using preprocesso...
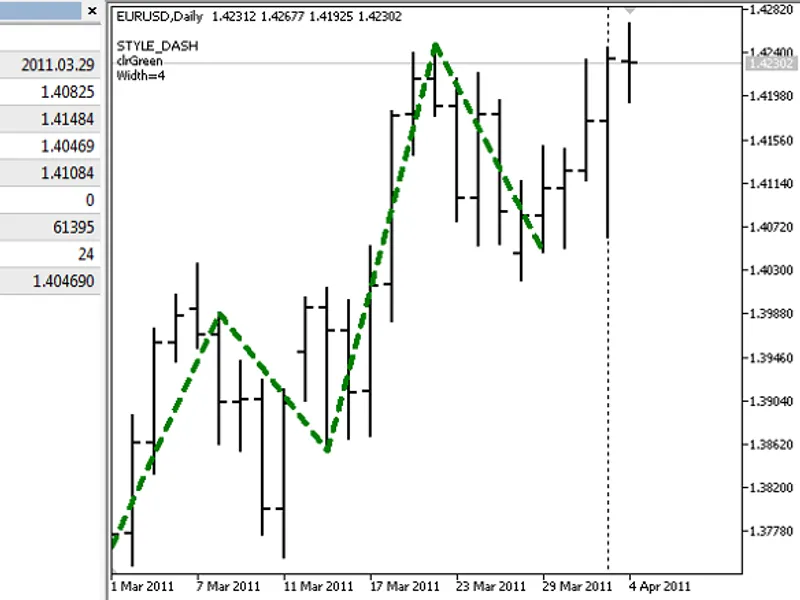
This indicator plots sections between the high and low prices of bars.The color, width, and style of the sections change randomly every N ticks.Initial properties of the plot are d...
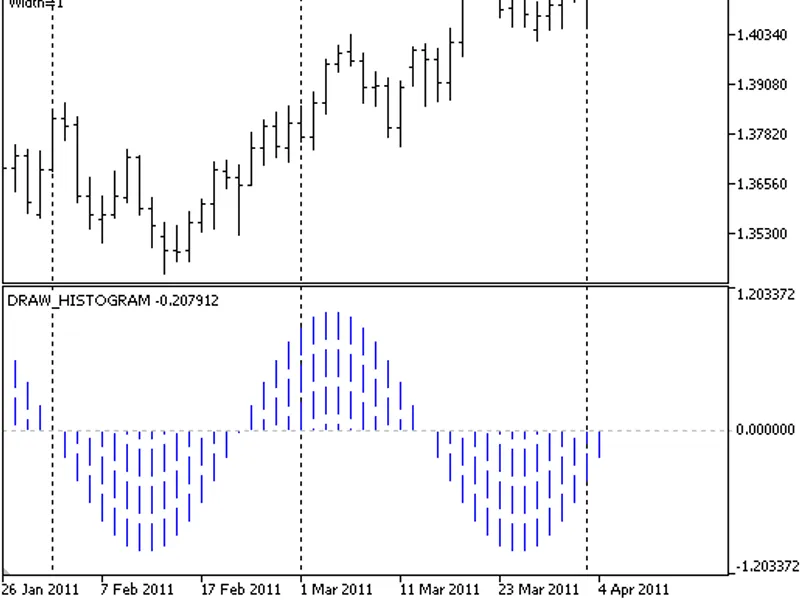
This indicator plots a graph of a function in a separate window.Indicator DescriptionThe histogram color, width, and line style are changed randomly every n ticks. The period of th...
This indicator plots a vertical section for each bar between the open and close prices.The indicator can be displayed in a separate window or the main chart window.It does not plot...
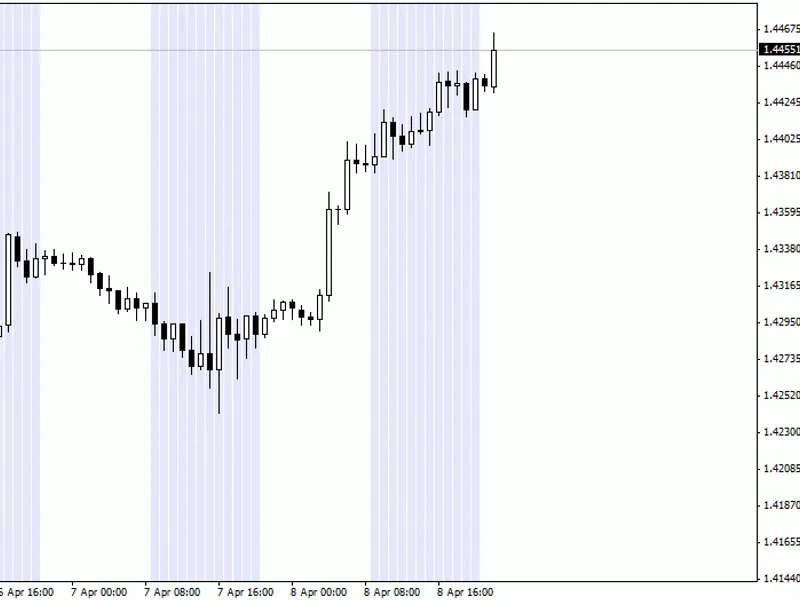
This indicator simply displays active hours as defined by the user, which is useful for visual backtesting.Key Features- Displays active hours defined by the user- Useful tool for ...
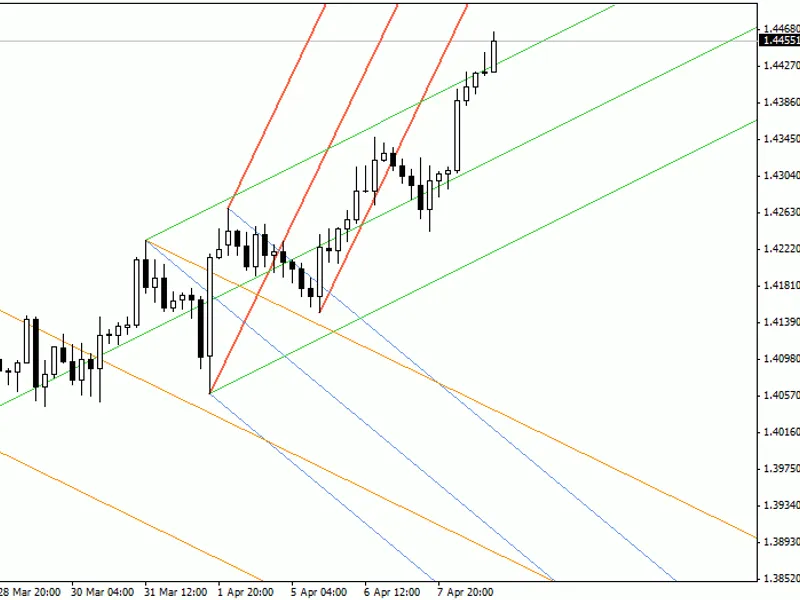
Automatic Andrews, Schiff, or Modified Schiff Pitchforks.Analysis suggests the Modified Schiff Pitchfork is the most effective.This tool automatically draws Andrew's Pitchfork, Sch...
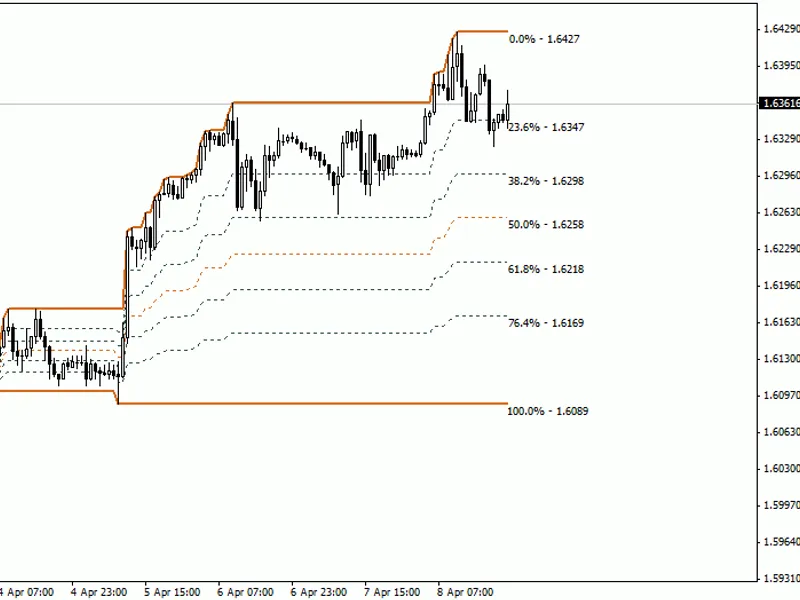
Intra-period Fibonacci is a useful tool for traders, providing insights into market trends and patterns within different time frames, such as month, week, day, and various hour int...
The indicator calculates your risk as a percentage and gives you the lot size that is acceptable for your risk. You only need to specify the risk in percent and the stop size in pi...
The JJ N-Promise indicator is designed to visualize market trends and identify divergences.This tool aims to provide traders with clear insights into potential shifts in momentum a...
This indicator displays profits and losses in both pips and money.Indicator SettingsThe indicator uses PosX and PosY for positioning, as these settings are preferred over corner pl...
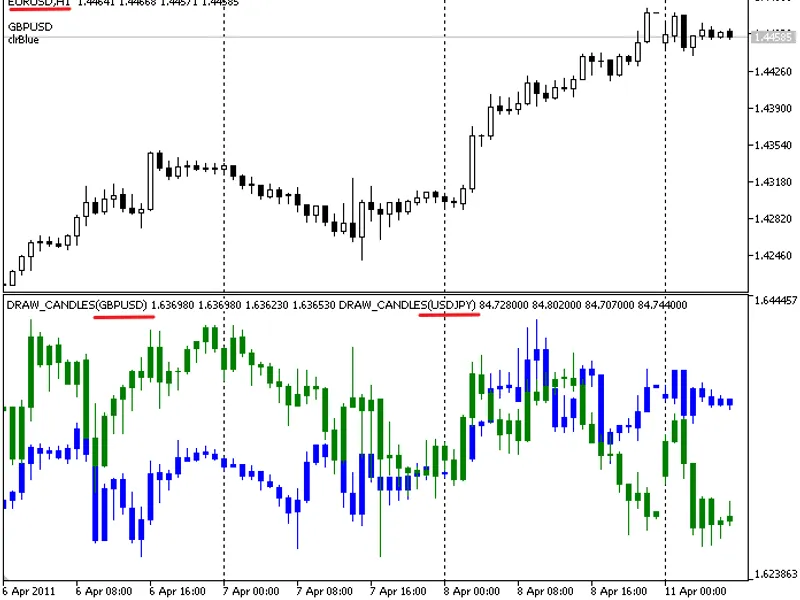
This indicator displays candlesticks for two symbols in a separate chart window.The indicator plots candles using the values from four indicator buffers representing open, high, lo...
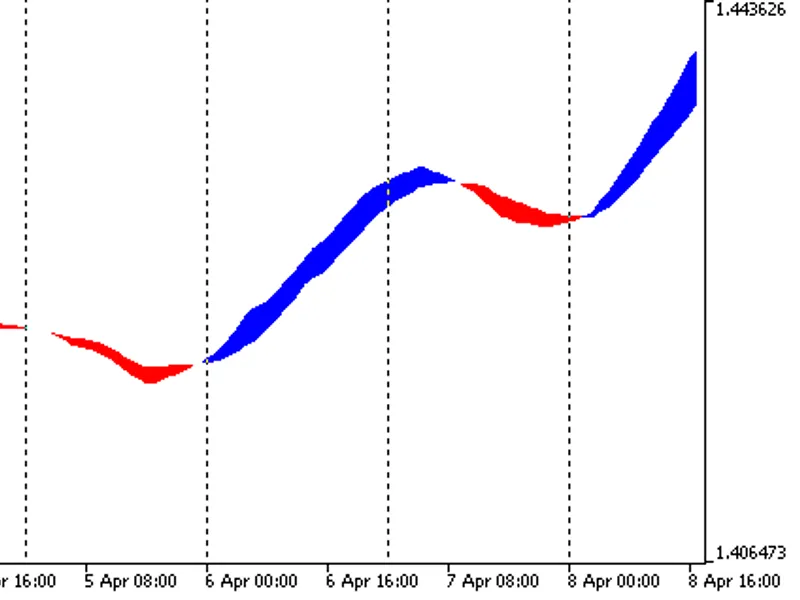
This indicator plots a channel based on two moving averages with different periods in a separate window.The change in the channel color indicates a trend change.The drawing style p...
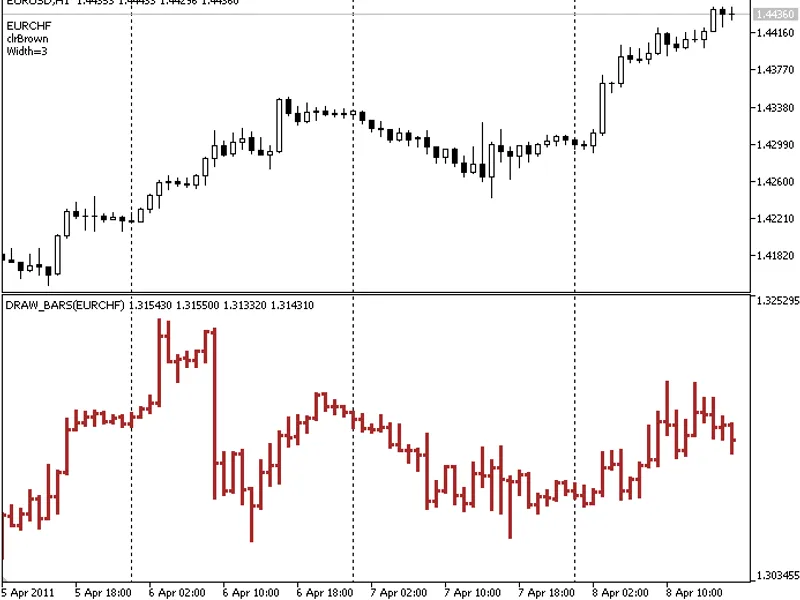
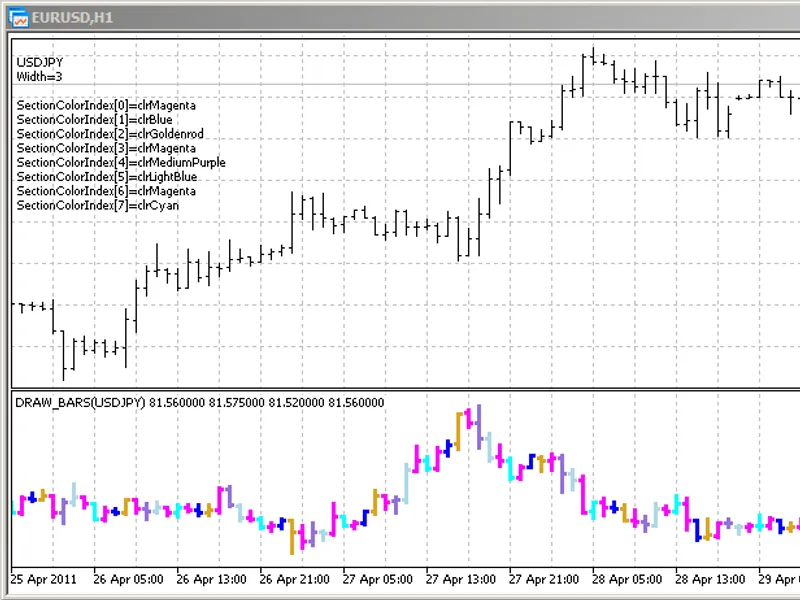
This indicator plots the bars of a specified symbol in a separate chart window.The indicator draws bars using the values from four indicator buffers representing the open, high, lo...
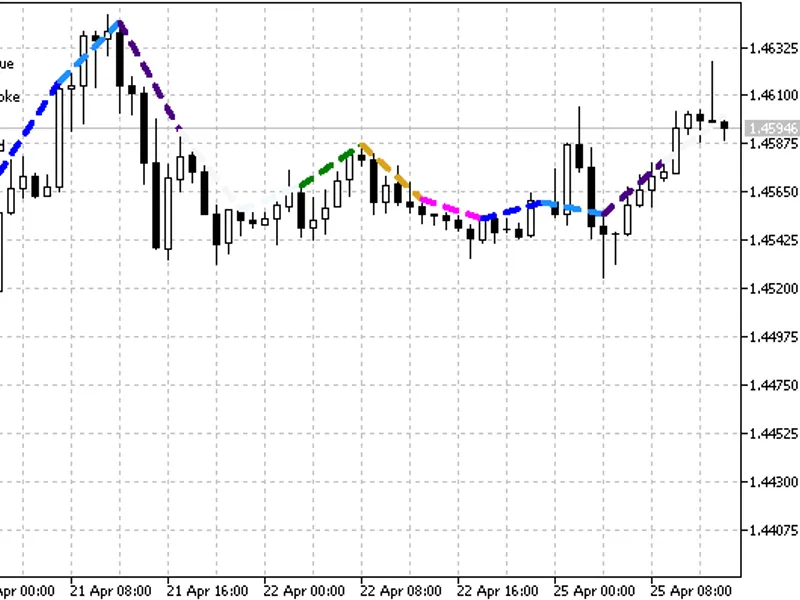
This indicator plots the ZigZag indicator using high and low prices.The drawing style allows for the creation of sections based on the values of two indicator buffers. This feature...
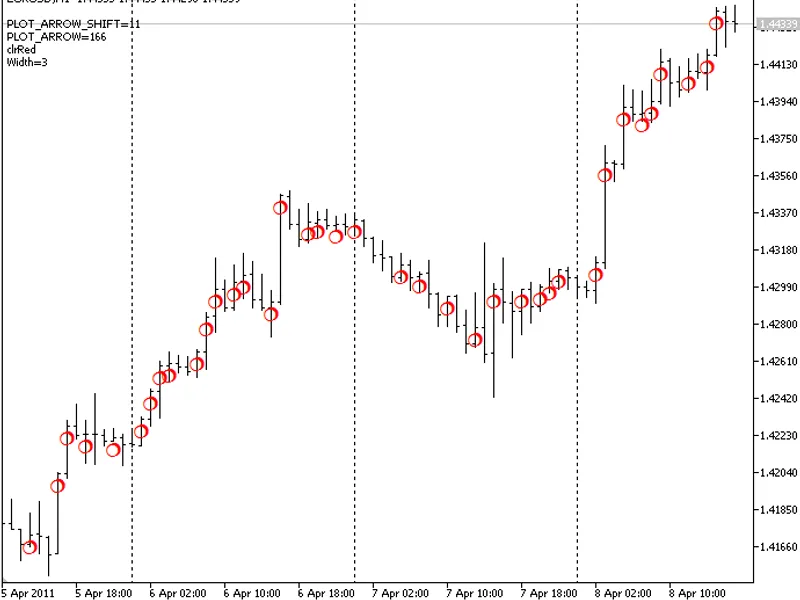
This indicator plots arrows on the chart when the current bar's closing price is greater than the previous bar's closing price.The color, width, shift, and character code of the ar...
This indicator identifies potential price reversals based on a sequence of bars and subsequent price action confirmation.Indicator LogicThe indicator analyzes the number of bars on...
IntroductionNumerous programs exist for creating self-similar sets defined by Iterated Function Systems (IFS). This article explores how to study these beautiful sets within the Me...
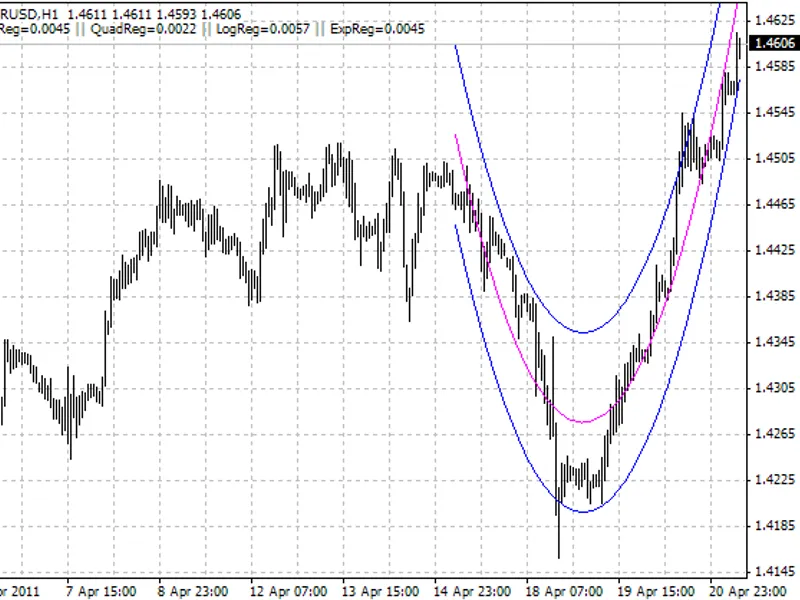
This indicator compares four types of regression: linear, quadratic, logarithmic, and exponential, selecting the one that best fits the analyzed data.Improvements and Corrections:-...
RD i Forex Forecast Indicator
Description: This indicator forecasts future price movements (highest and lowest) by analyzing similar past price patterns using a weighted mean. It ...
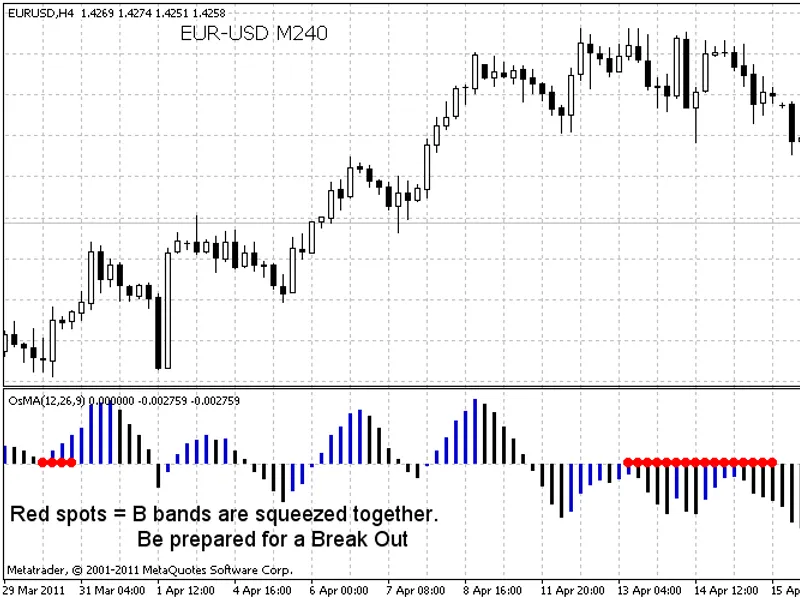
BB Squeeze Indicator with OSMA MomentumThis indicator is a variation of the BB Squeeze indicator that utilizes OSMA (Oscillator of Moving Average Convergence Divergence) for moment...
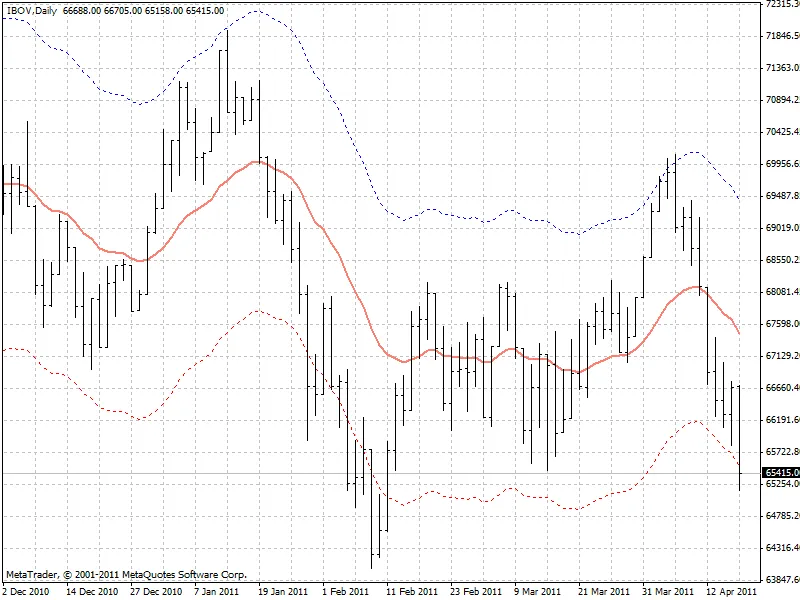
This indicator automatically calculates and displays Exponential Moving Average (EMA) envelopes.It provides a visual representation of price volatility and potential trading ranges...
Premier Stochastic Oscillator [v01]
This indicator is based on an article published in TASC magazine by Lee Leibfarth in August 2008.
Refer to the original article for detailed e...
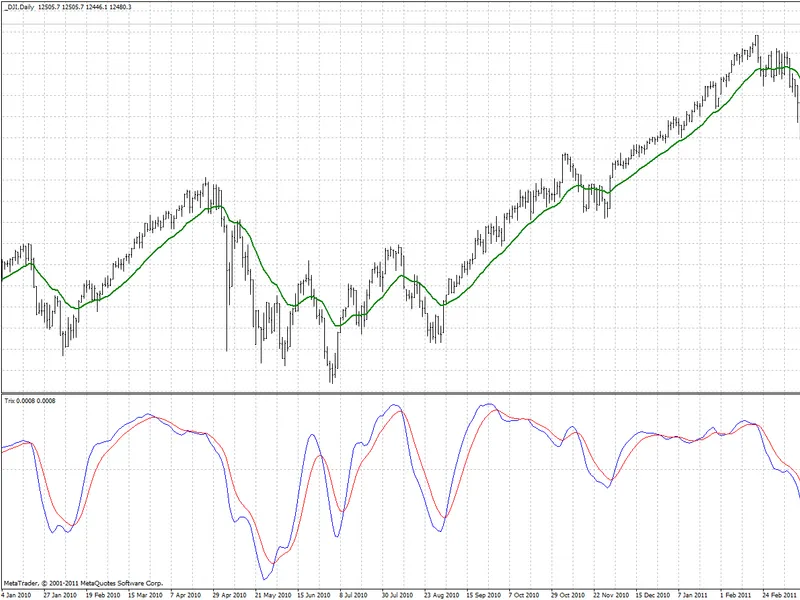
The TRIX Indicator is a versatile technical analysis tool designed for the MetaTrader 4 and MetaTrader 5 platforms.This indicator provides traders with a reliable method for analyz...
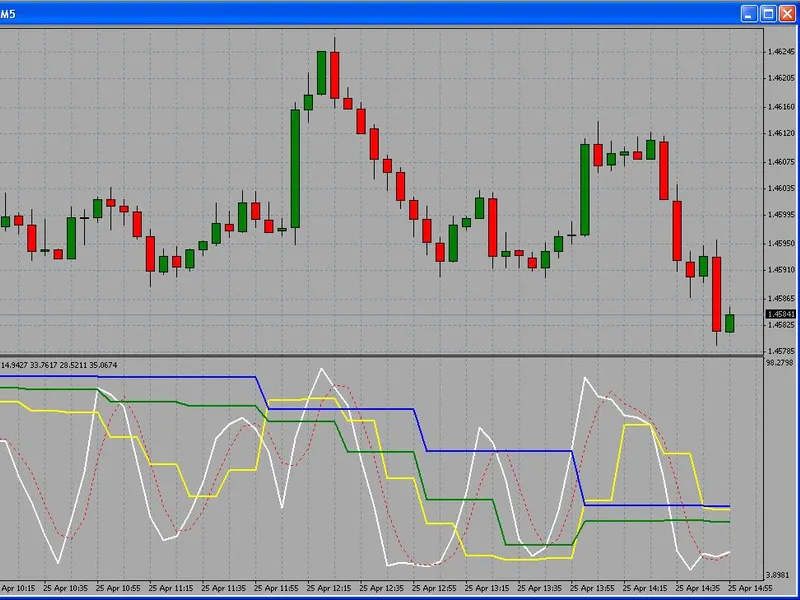
This indicator allows you to utilize the Stochastic Oscillator across a single current timeframe or up to four different timeframes. When configured for multiple timeframes (timefr...
This indicator automatically draws envelopes around price action based on configurable parameters. It can be used for identifying potential trading ranges, overbought/oversold cond...
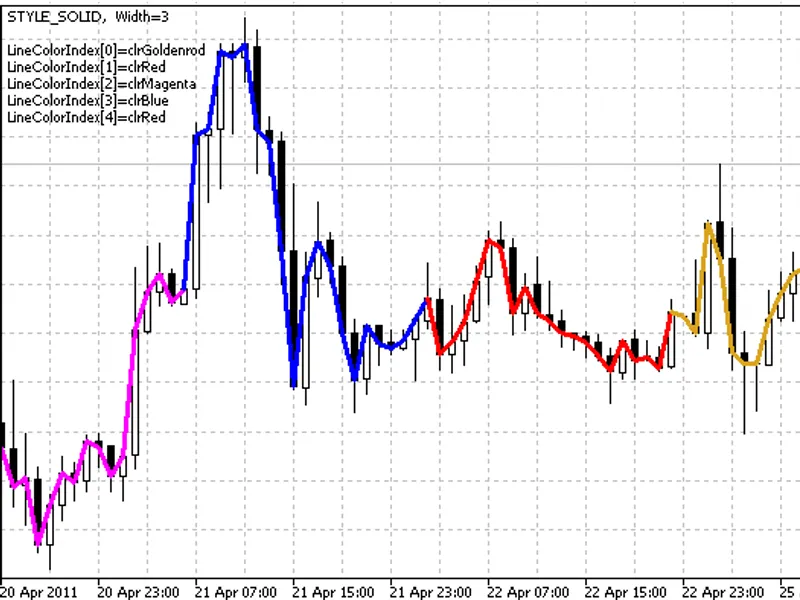
This indicator plots a line based on the closing price, with colors changing according to the specified drawing style.It utilizes two indicator buffers. The first buffer stores the...
This indicator demonstrates drawing styles by plotting color sections with a specified number of bars. Two indicator buffers are utilized: the first stores the high price of the ba...
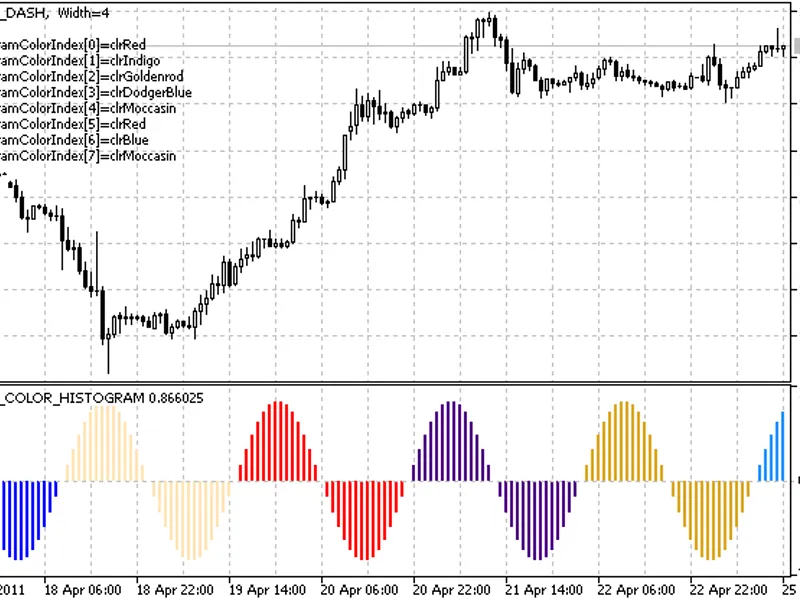
This indicator demonstrates drawing styles by plotting a sin(x) function as a color histogram in a separate window.
Two indicator buffers are utilized: the first contains the sin(x...
This indicator demonstrates drawing styles for each bar by plotting a section between the open and close prices.It utilizes three indicator buffers:- The first buffer stores the hi...
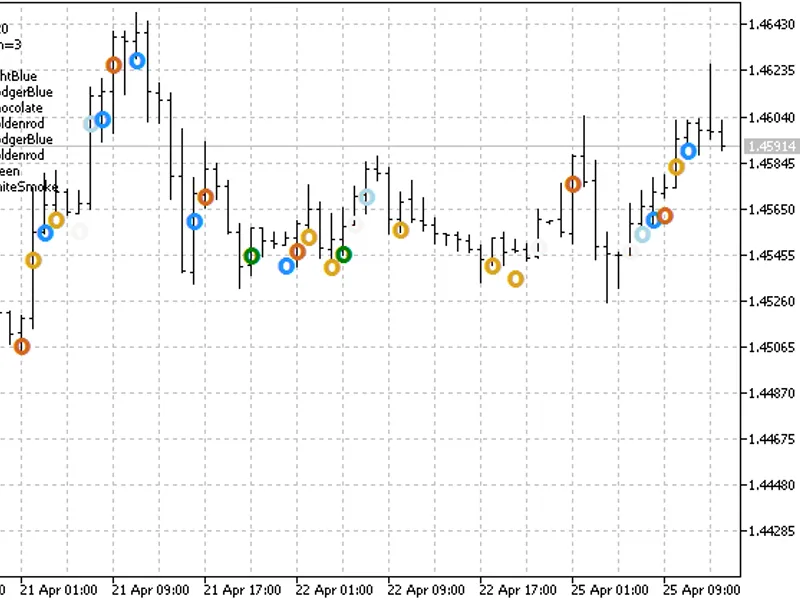
This indicator demonstrates a method for drawing arrows on the chart.It utilizes symbols from the windings font to represent these arrows.Two indicator buffers are employed: one st...
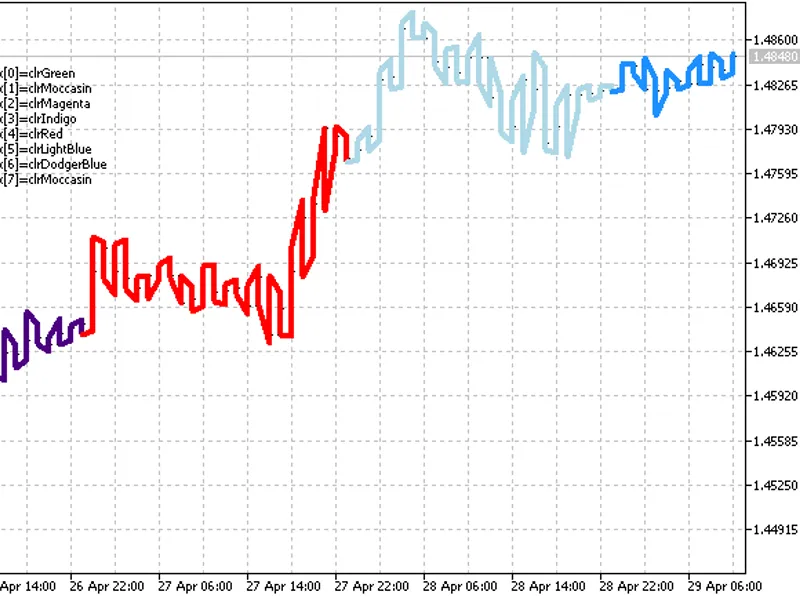
An indicator that draws a ZigZag based on high and low prices, utilizing a customizable drawing style.The color, thickness, and style of the ZigZag lines are randomly changed every...
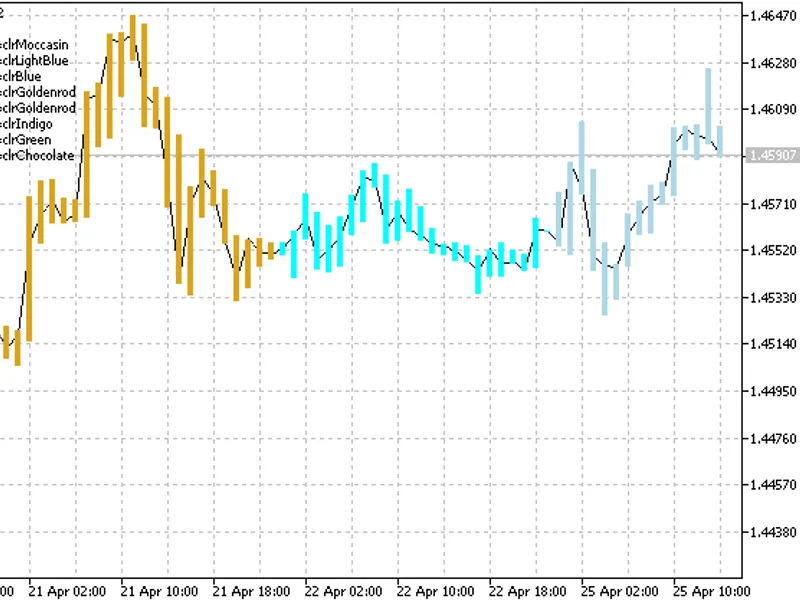
This is an example indicator that draws bars for a specified instrument in a separate window.The color of the bars changes randomly every N ticks.The N parameter of the indicator i...
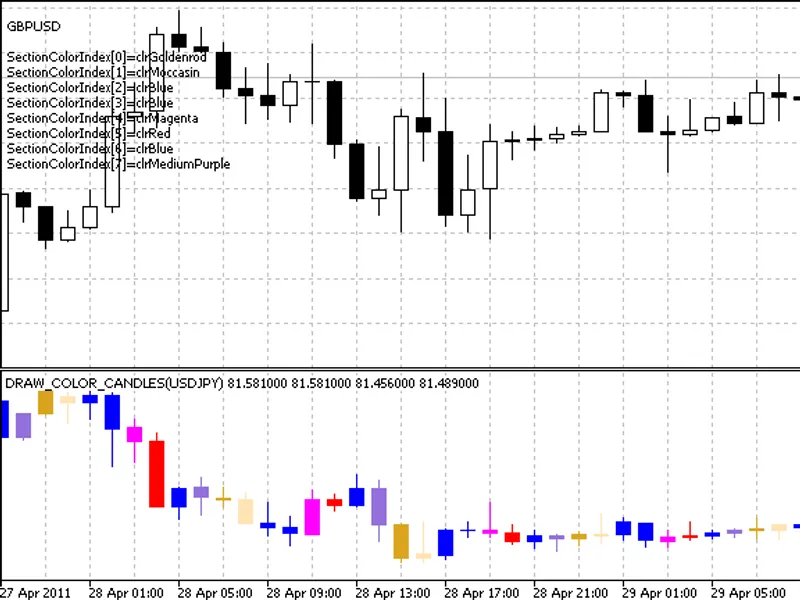
This is an example of an indicator that draws candlesticks for a specified instrument in a separate window.Indicator DescriptionThe color of the candlesticks changes randomly every...
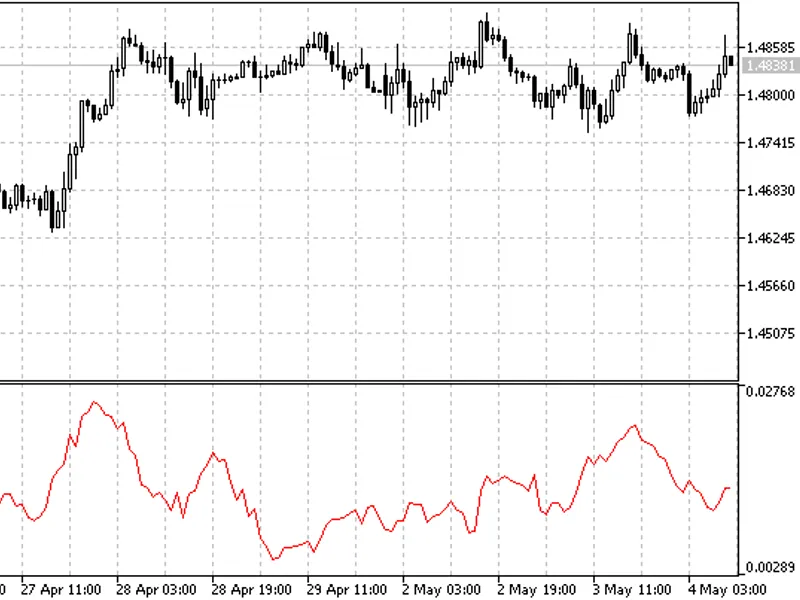
The Kaufman Volatility Indicator (KVI) is a technical analysis tool designed to measure the degree of price variation in a financial market.Developed by Perry J. Kaufman, this indi...
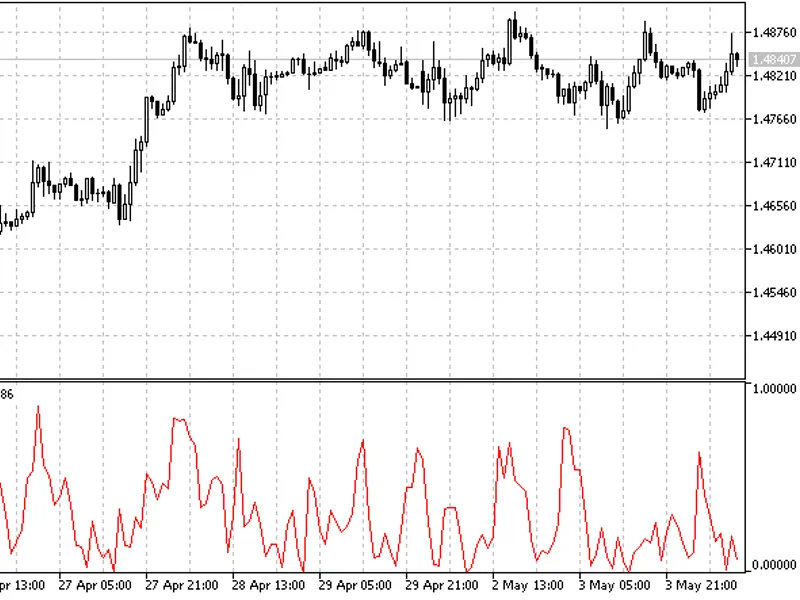
The Kaufman Efficiency Ratio (KER) is a technical indicator developed by Perry Kaufman. It measures the efficiency of price movement by comparing the distance prices have moved to ...
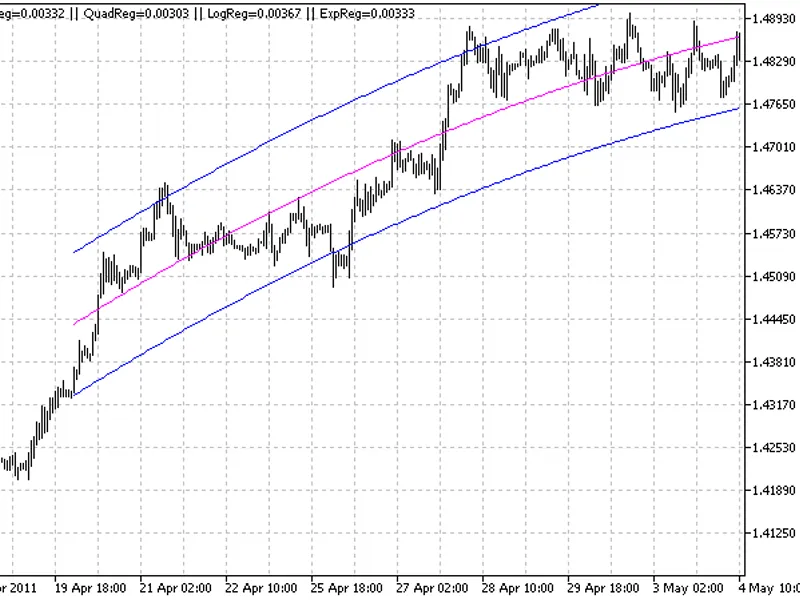
This indicator performs a regression analysis, comparing four types: linear, quadratic, logarithmic, and exponential. It automatically selects the regression type that best fits th...
This EA automatically moves your stop loss to break even at a predefined level.Instructions for UseTo use the Stop Loss Mover EA, copy it into the experts folder of MetaTrader. Ope...
This is an introductory Expert Advisor (EA) provided for users to review and build upon.Recommendations for Use:- Currency Pair: EURUSD only- Timeframe: 15-minute chart- Initial Ca...
Send up to 50 selected price quotes directly via email from your MetaTrader platform.Important: This Expert Advisor may encounter issues in certain configurations, resulting in the...
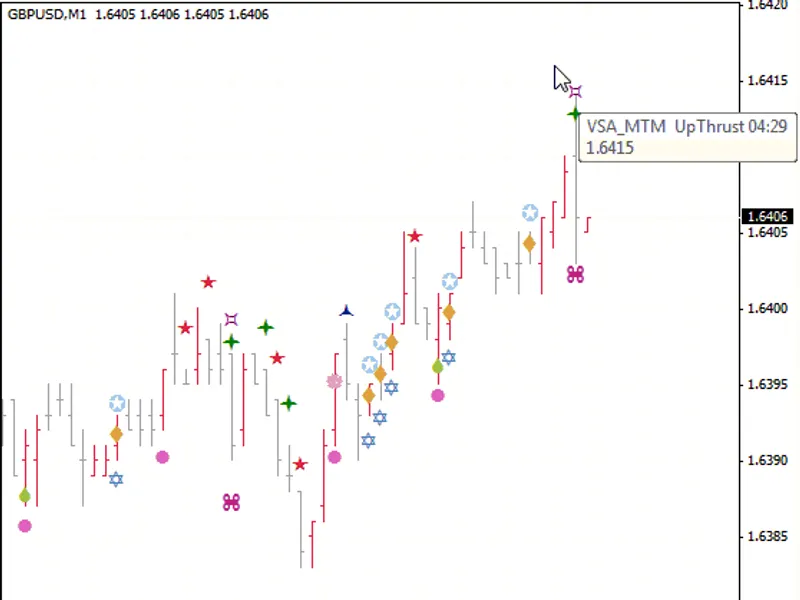
This is a discussion about the Volume Spread Analysis, or VSA, method developed by Tom Williams.
It provides signals in the form of arrow signs.
To effectively trade using VSA, it ...