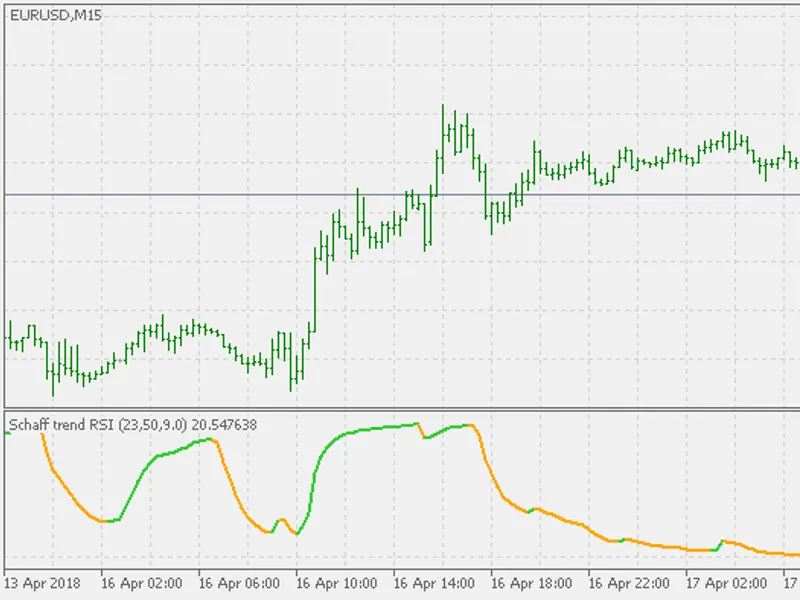
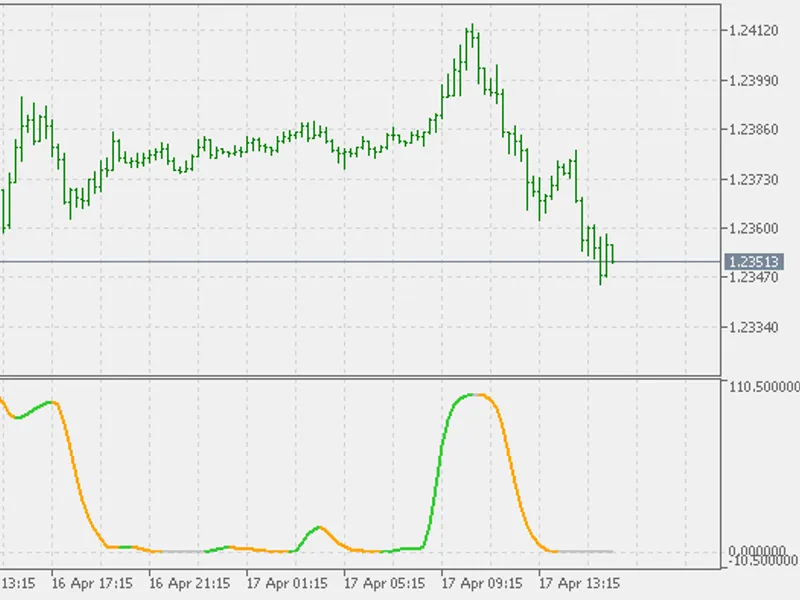
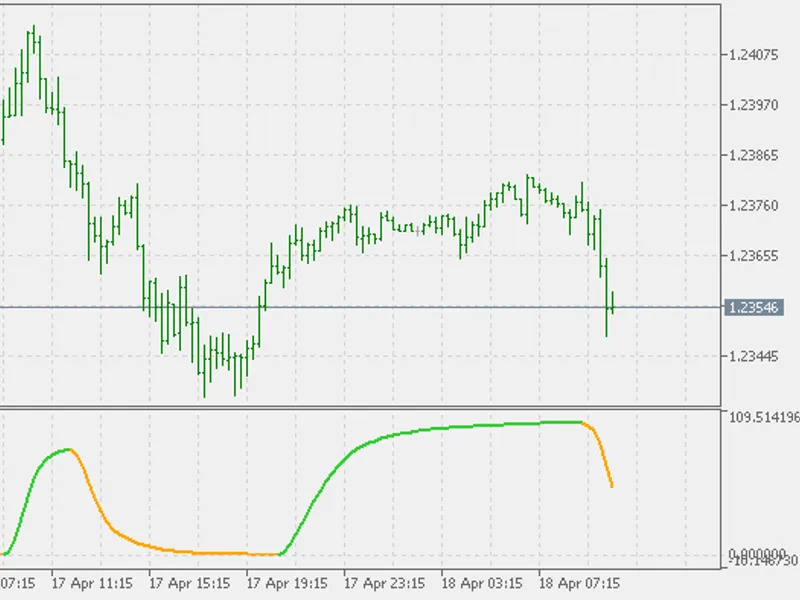
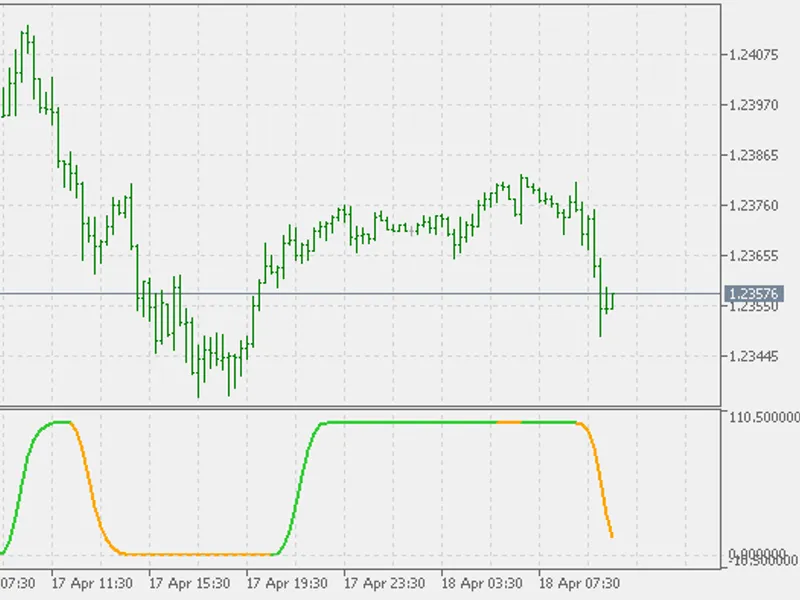
The Schaff Trend RS I is a lesser-known indicator in the Schaff Trend series. It is essentially an RSI of the MACD, which can be likened to a double-smoothed stochastic of a MACD. ...
The Schaff Trend RSX indicator is a valuable tool for traders, but its reliance on the RSI slope as a signal can lead to an abundance of signals, which may not be ideal for all tra...
Doug Schaff's indicators are designed to evaluate trends. One of his indicators, Schaff CD, is a variation of the MACD signal line. This indicator scales the trend from zero to 100...
This indicator is a variation of the Schaff Trend Cycle (STC) that incorporates the RSX (Relative Strength Index Smoothed) to enhance signal accuracy.By utilizing the RSX, which is...
An MQL5 implementation of an adaptive trading strategy.The General Theory of Trading (GTT) proposes that profit is made by synchronizing one's trading function with the market.This...
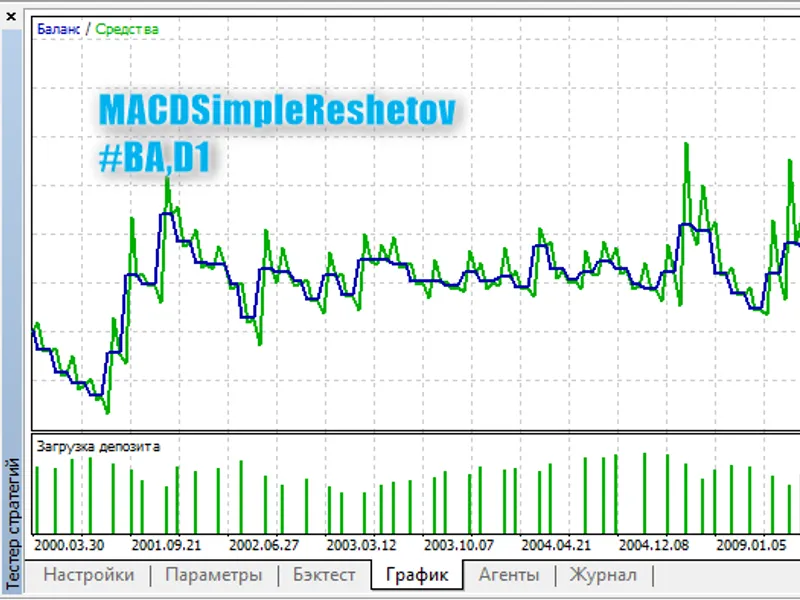
The Expert Advisor (EA) operates based on the Moving Average Convergence Divergence (MACD) indicator. It opens trades when the MACD and signal lines have the same sign and closes t...
Trailing Stop Break-even, which is also the trailing step parameter, must be set to a value greater than 0. The EA operates by first attempting to move a position to breakeven, the...
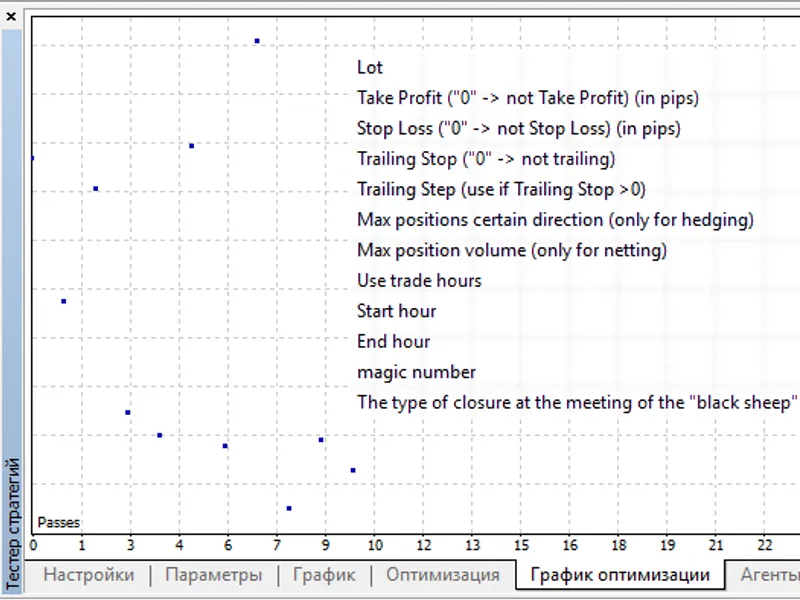
The Expert Advisor (EA) identifies N consecutive identical candlesticks and executes trades based on their direction. It supports both hedging and netting account types, utilizing ...
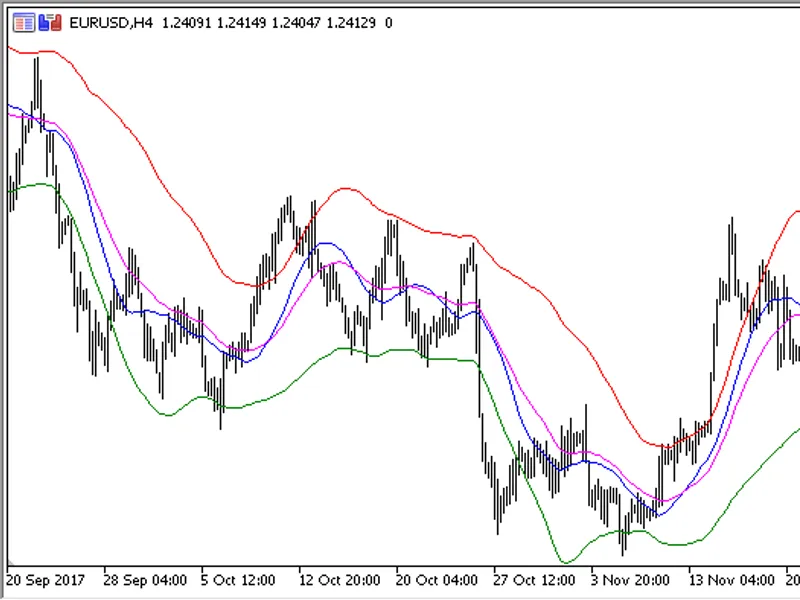
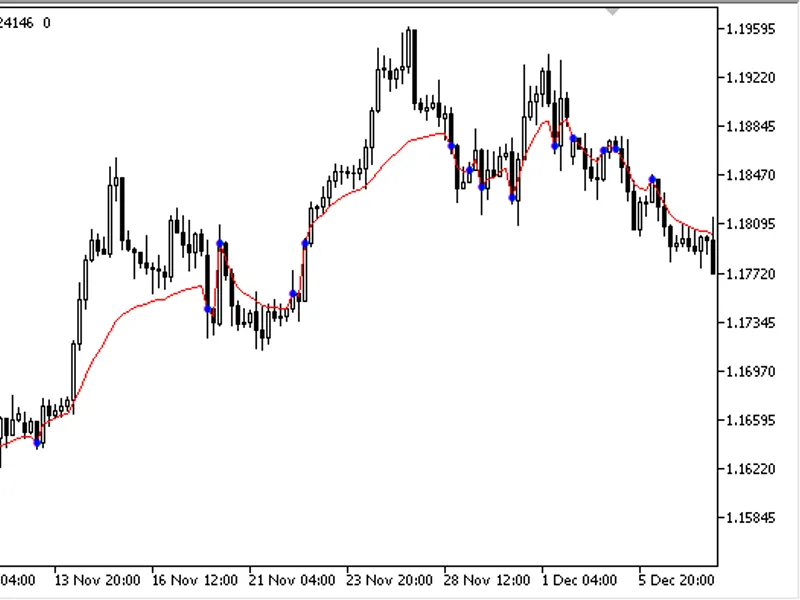
This indicator displays the 'Safe Zone', a trading concept based on price action and moving averages. The zone is calculated using high, low, and close prices, along with a moving ...
When a signal emerges, the EA closes an opposite position. It can also close half of the position (based on the 'profit for closing half of the position' parameter) and move a posi...
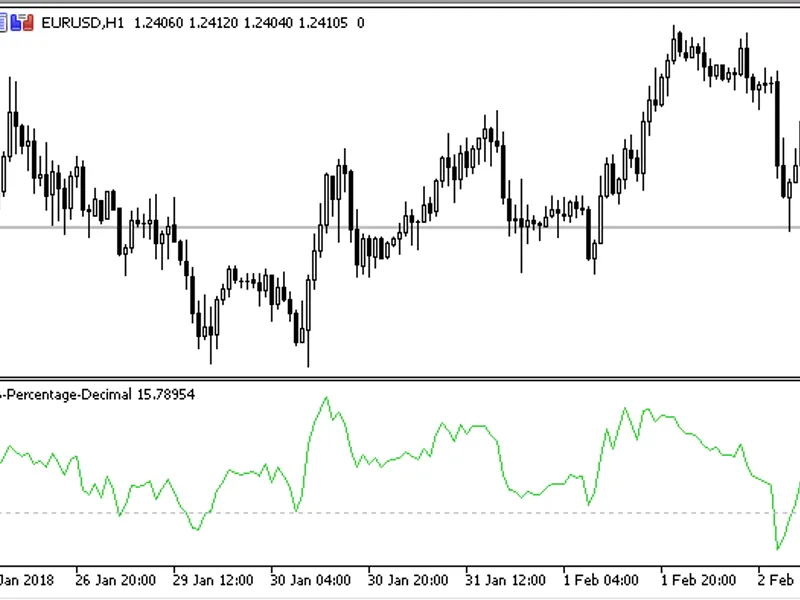
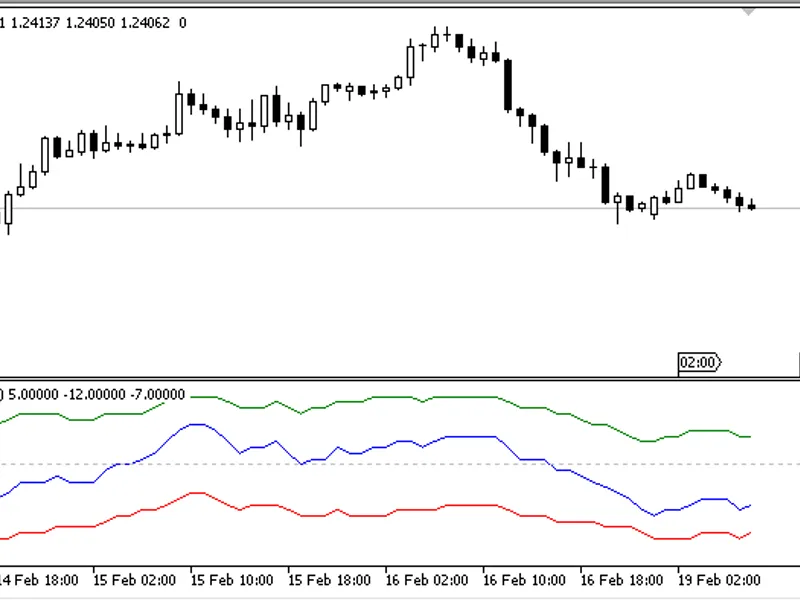
The indicator displays Bollinger Bands in a separate window as an oscillator.It offers three customizable parameters:- Period- Bands Deviation- Applied Price for calculations.This ...
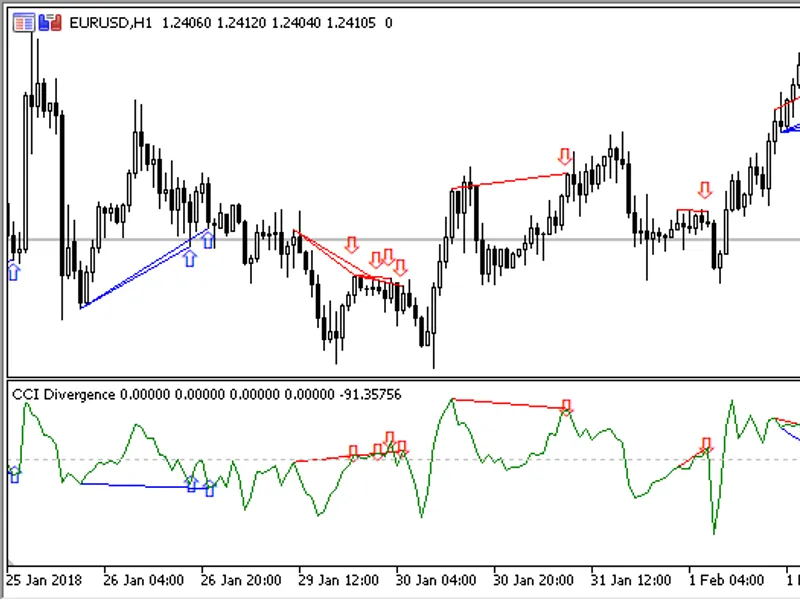
The custom indicator CCI_Divergence provides a comprehensive analysis tool by plotting the CCI (Commodity Channel Index) indicator in a separate window and identifying divergences ...
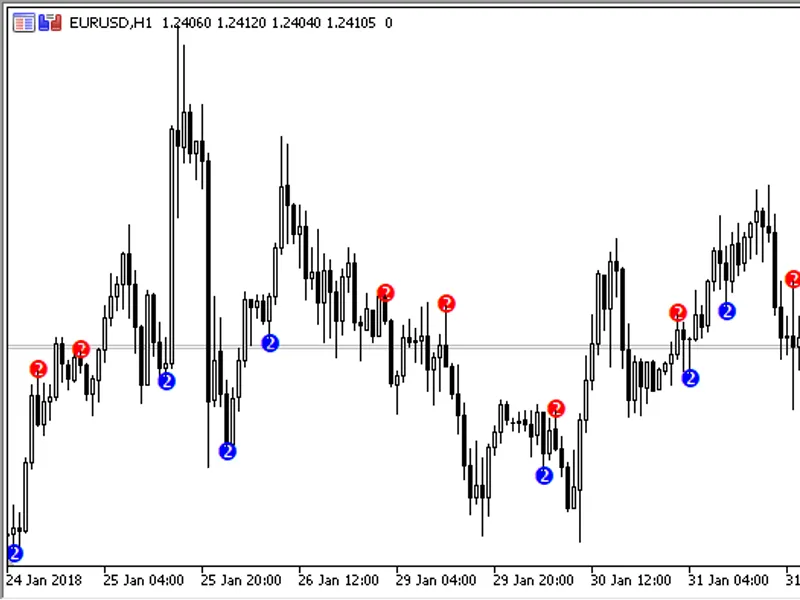
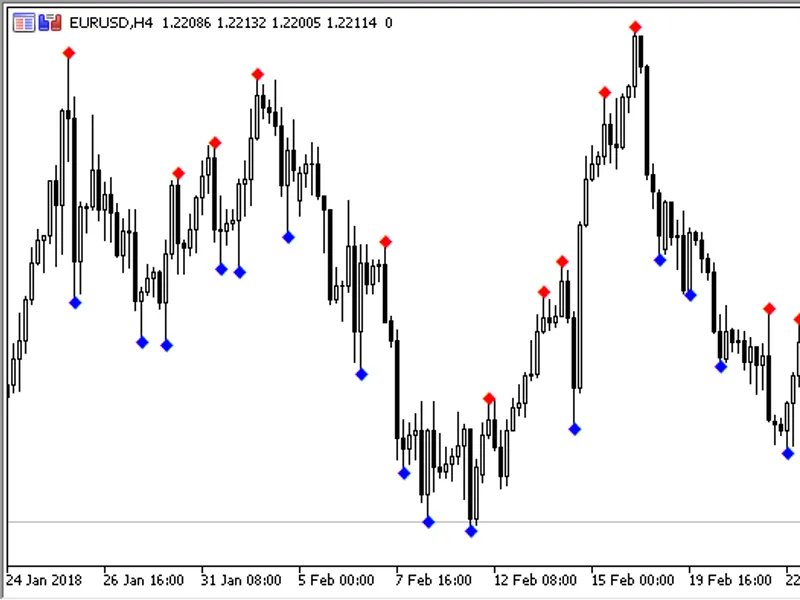
The Multiple Fractals indicator enables the identification and simultaneous visualization of fractals with varying dimensions on the price chart.It scans for fractals ranging from ...
The New High New Low Index indicator displays the high/low values of a symbol.It calculates the difference between the number of highest highs and the number of lowest lows for a s...
This library is an advanced version of the original, with new features and improvements.Version 2 introduces the following enhancements:The 'Type of Trade' parameter offers three o...
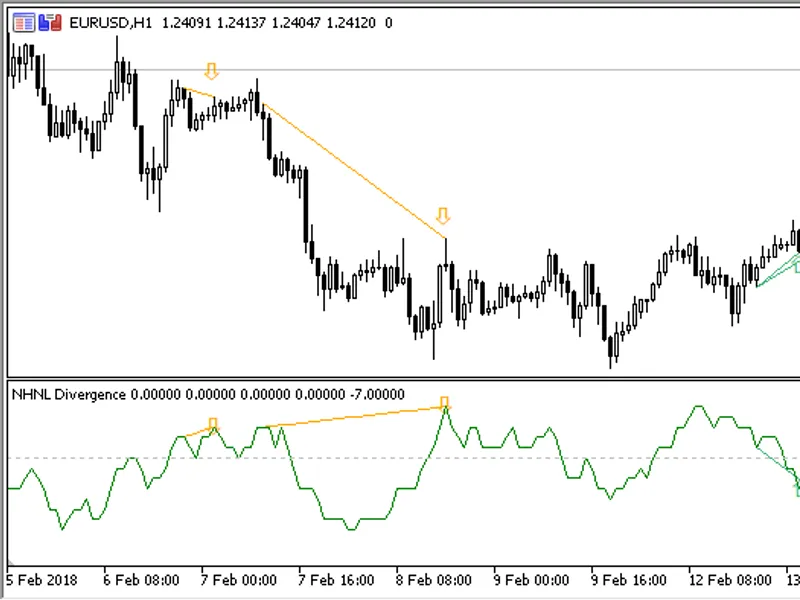
The NHNL_Divergence indicator is a custom tool that enhances your trading analysis by visualizing divergences between price and the NHNL index.This indicator operates independently...
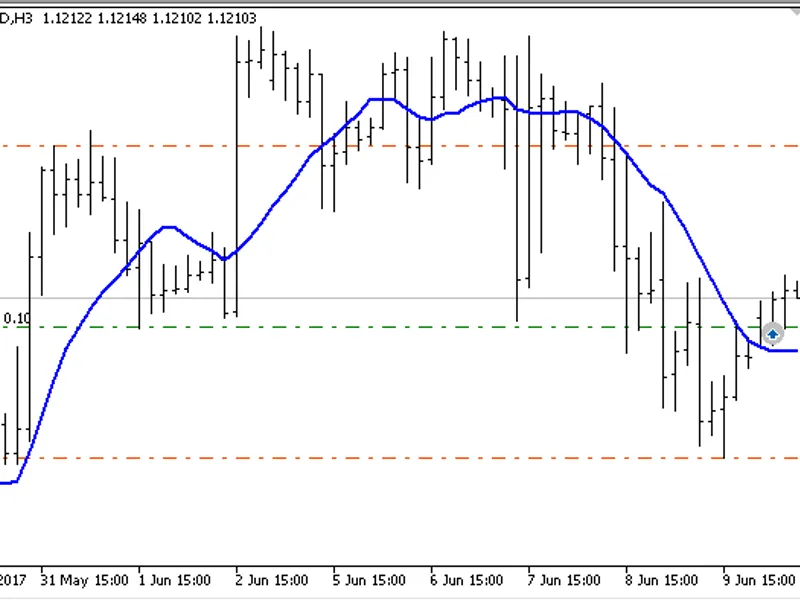
This indicator is designed to assist traders in identifying potential support and resistance levels based on moving averages.Key Features:- Calculates dynamic support and resistanc...
A unique Moving Average (MA) indicator with a dynamic calculation period.This indicator calculates the SMA with an increasing period, resetting at the start of each new calculation...
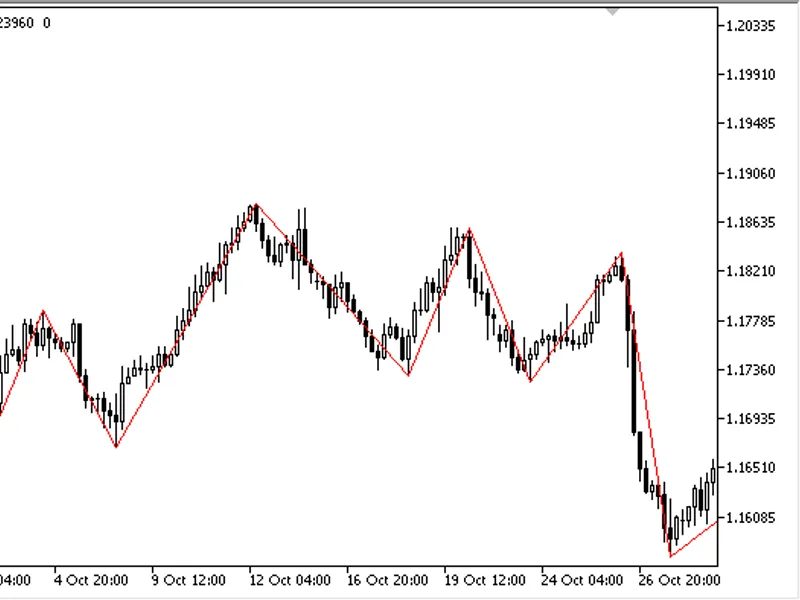
The indicator draws a simple zigzag on the price chart, requiring only the step value as input. Break points are added when the zigzag leg length exceeds the specified step.The ind...
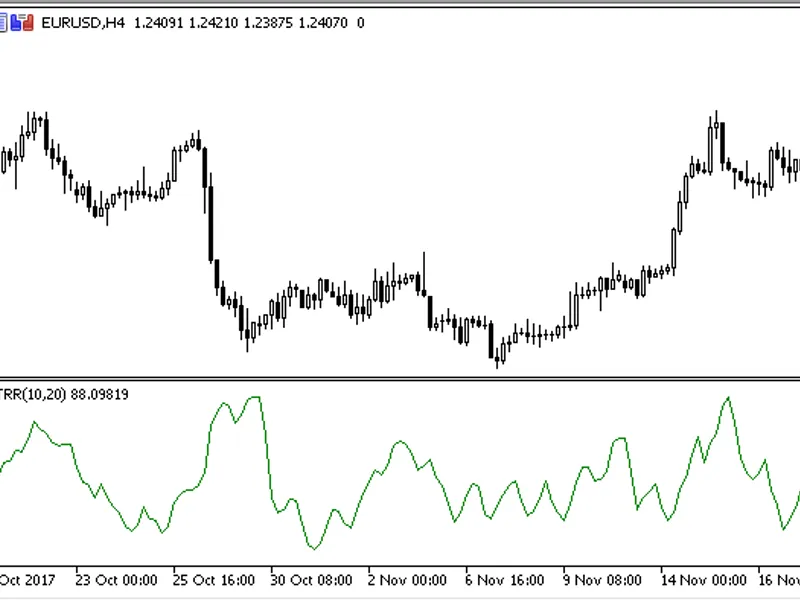
The indicator displays the ratio of two Average True Range (ATR) values with different periods.The formula is:ATR Ratio = (ATR1/ATR2) * 100Parameters:- ATR1 Period: ATR1 calculatio...
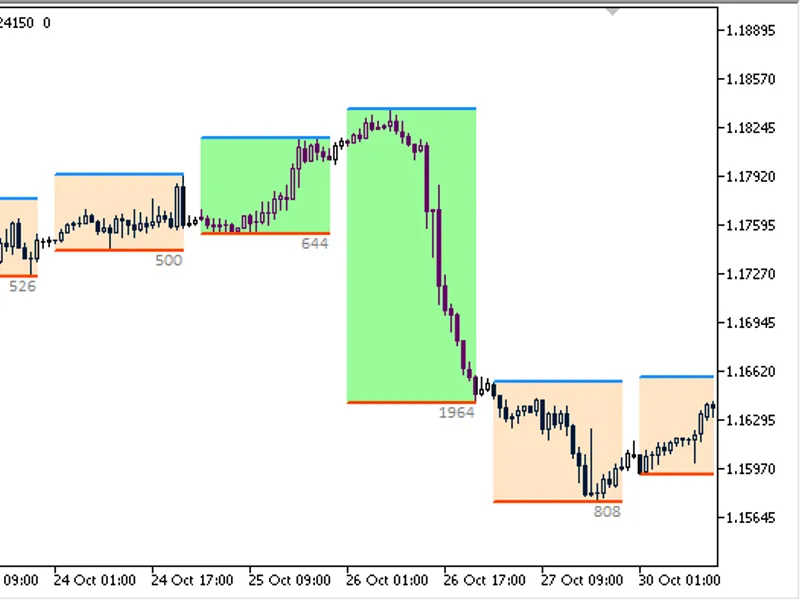
The indicator displays the previous trading day's channel on the chart, allowing for the customization of trading day start and end hours. Channels are color-coded based on their s...
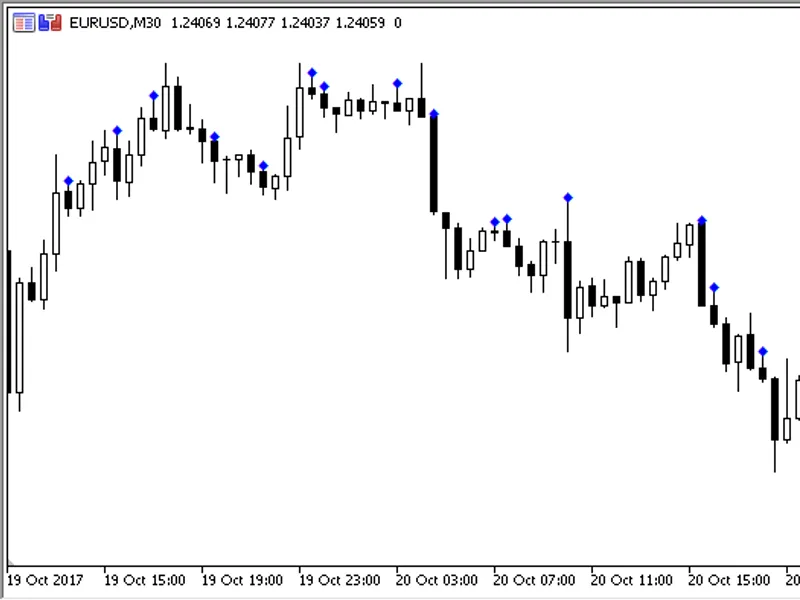
The indicator identifies and displays custom patterns on a chart based on the settings provided. These patterns are defined using a text code, where:- u represents a bullish candle...
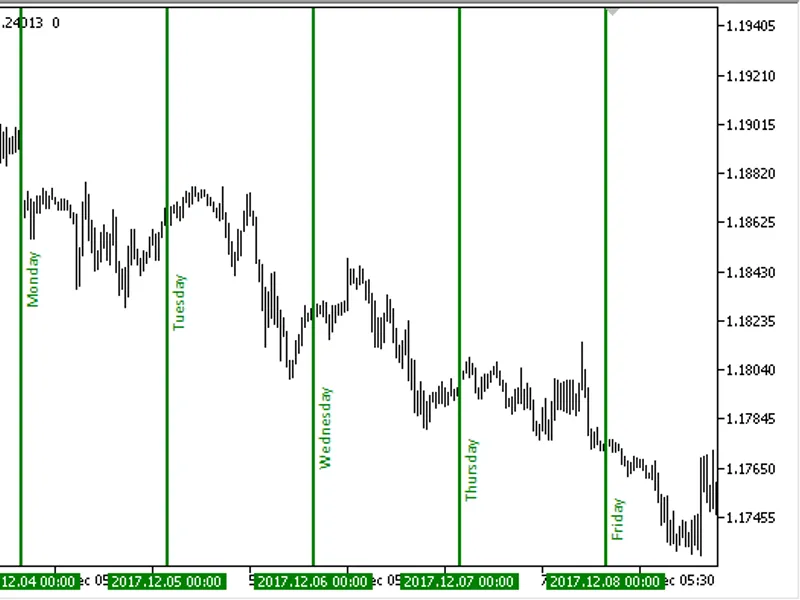
The indicator displays the days of the week, months, and years as lines and text labels on the chart.It offers a comprehensive set of customization options with 31 input parameters...
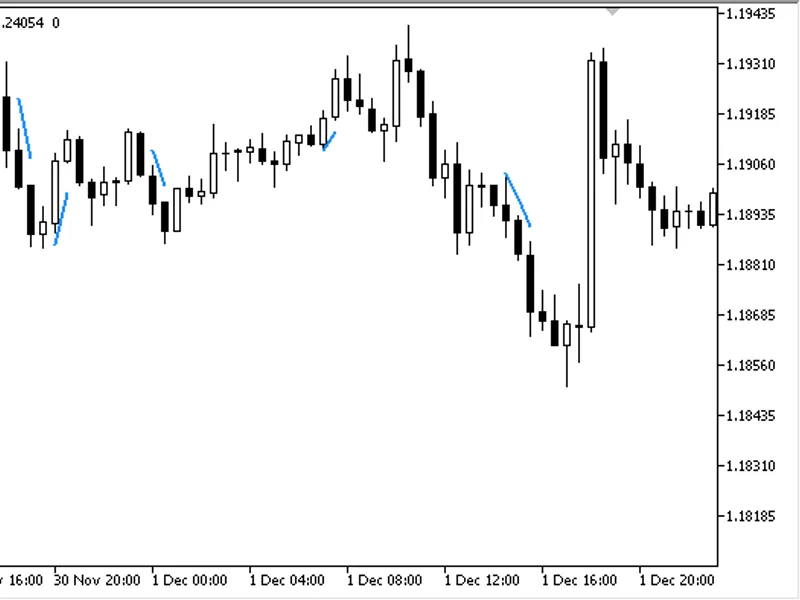
The KoT (Keep On Trading) indicator provides guidance on when to hold or close a position. When there is an open buy position, the indicator displays a line below the price, indica...
This indicator calculates and displays overbought and oversold levels in a separate window, using a moving average relative to the Average True Range (ATR).The formula is as follow...
The PMF (Pivot Money Flow) indicator is a powerful tool for traders, providing insights into the direction and reversal of money flows.This indicator offers two key parameters to c...
The indicator is similar to the standard MACD, but it is calculated using both MACD and SAR, providing more confident signals in trend areas. Overbought/oversold levels help track ...
The Expert Advisor utilizes a popular indicator of thirty candlestick patterns.This EA offers flexibility in position management, accommodating various trading styles. It supports ...
What's new in version 2This Expert Advisor (EA) has been enhanced to enable the configuration of two distinct time intervals for opening positions, along with the ability to specif...
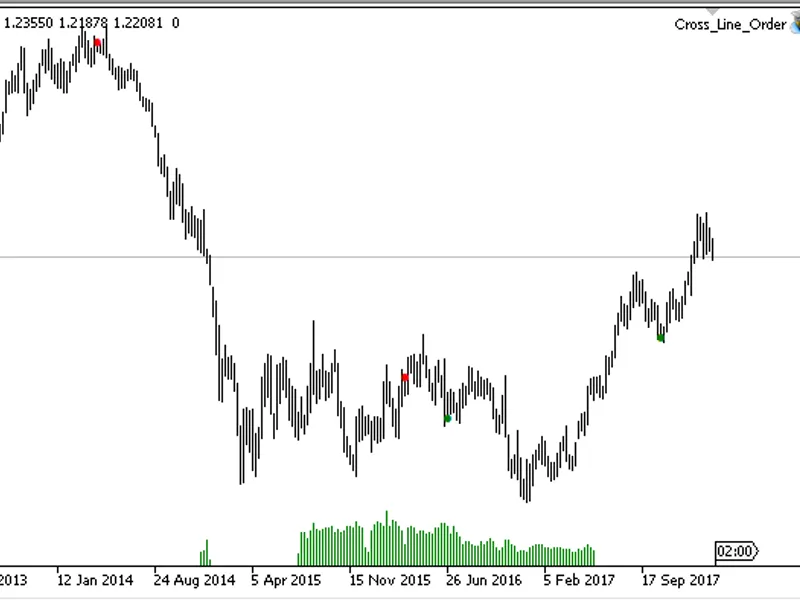
The expert advisor is based on the indicator.The calculation period of the indicator is constantly increased starting from the intersection of its line with the price until the nex...
A simple oscillator based on the values of three indicators: Istochastic, IRSI, and IMomentum. It is displayed as a two-coloured histogram.The indicator calculation formula is:Kwan...
The XRSIDEMARKER Histogram is a color histogram that displays a non-trivial linear combination of IRSI and IDEMARKER, two popular indicators in the MetaTrader 4/5 platform.Indicato...
The XRSI Marker Histogram HTF indicator offers the flexibility to modify the indicator's timeframe through input parameters.To activate the indicator, ensure the xrsidemarker_histo...
The Kwan NRP HTF indicator offers the flexibility to modify the indicator's timeframe through input parameters.To activate the indicator, place the kwan_nrp.ex5 indicator file in t...
This indicator is an enhanced version of the MACD with extended settings.In addition to the standard parameters, such as fast and slow Exponential Moving Average (EMA) periods, sig...
This indicator displays fractals with customizable dimensions on a price chart. Unlike traditional fractals with fixed dimensions like 2x2 or 3x3, this tool enables the setting of ...
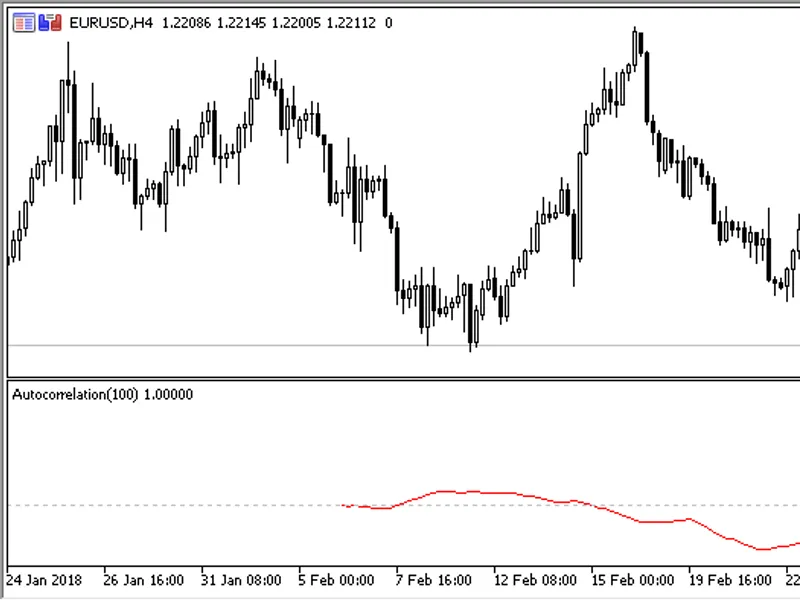
This indicator calculates and visually represents the autocorrelation function on a chart, illustrating the relationship between a function (signal) and its shifted copy based on t...
The indicator identifies and highlights the 'Inside Bar' pattern on the chart. This pattern consists of two candlesticks, where the current candlestick is contained within the prev...
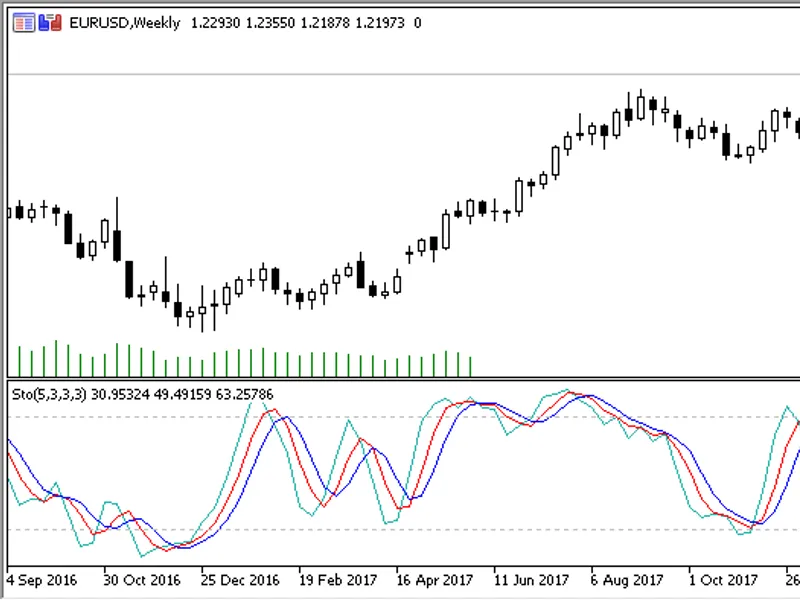
The Special Slow Stochastic (SSS) indicator is an enhanced version of the standard stochastic oscillator. It introduces an additional smoothed line, providing a more refined analys...
This indicator offers three calculation methods:- Classical- Classical Incremental (standard in the terminal)- Trade Station Incremental (calculation with an increment like Trade S...
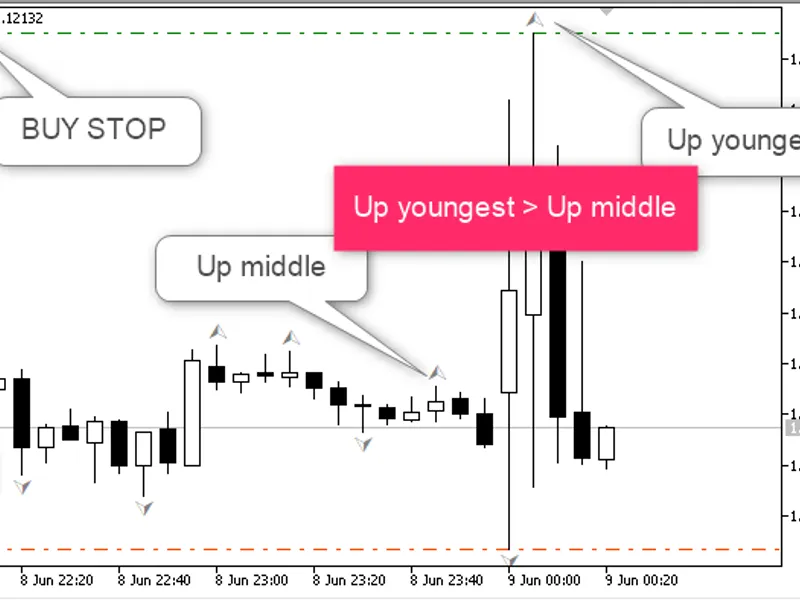
This expert advisor utilizes the iFractals indicator to generate trading signals for pending buy stop and sell stop orders, while also adjusting stop loss levels for open positions...
An introduction to mathematical functions in programming:The 'ceil' function returns the nearest upper integer.The 'round' function rounds a number to the nearest integer.The 'floo...
The Expert Advisor calculates the nearest upper and lower "round" price, depending on the step of the "round" number. The EA checks the position of the price and the Adaptive Movin...
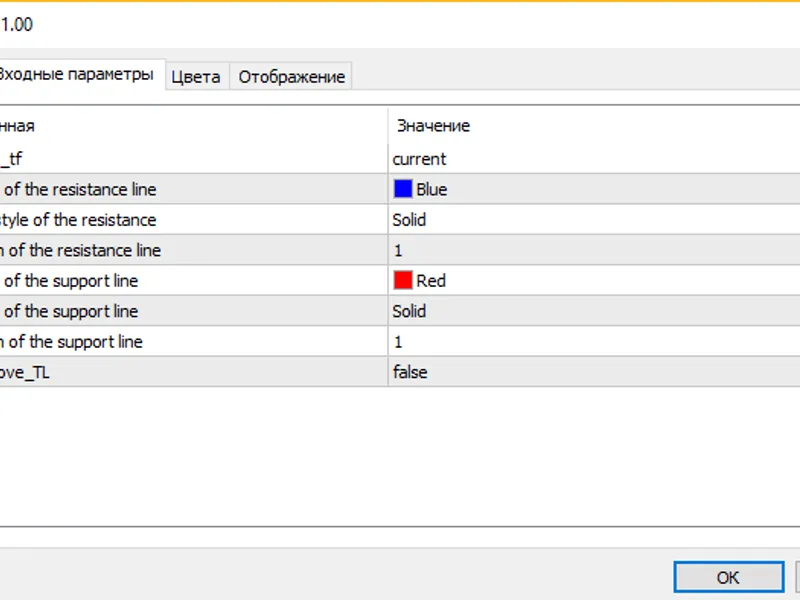
An indicator for automatic trendline drawing based on fractals of a specified timeframe.Input Parameters:base_tf- The timeframe for fractal calculation, which determines the trendl...
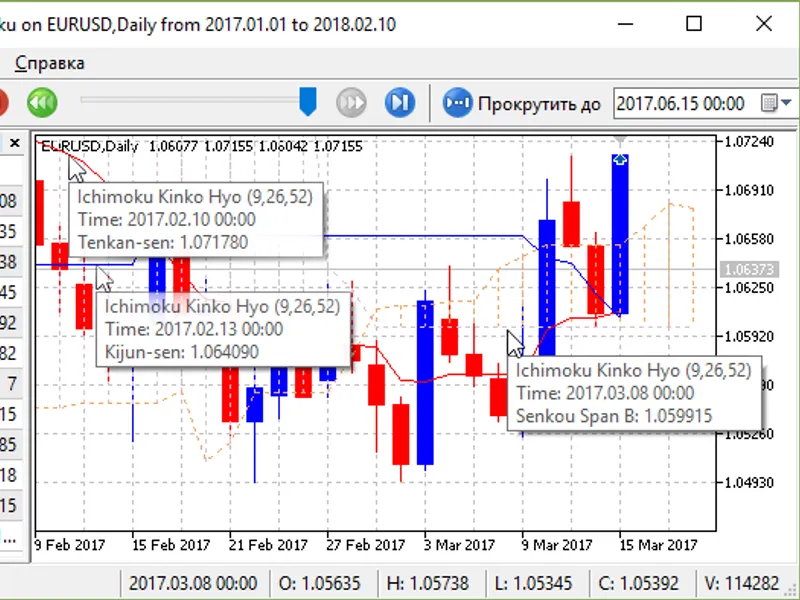
Buy Position Opening Rule:- Tenkan-sen on bar #1 < kijun-sen on bar #0- Tenkan-sen on bar #0 >= kijun-sen on bar #0- Close of bar #0 > senkou span b on bar #0Sell Position Opening ...
This Expert Advisor (EA) is designed to place pending buy stop and sell stop orders based on price extremes within a specified range of bars. The EA identifies the highest and lowe...
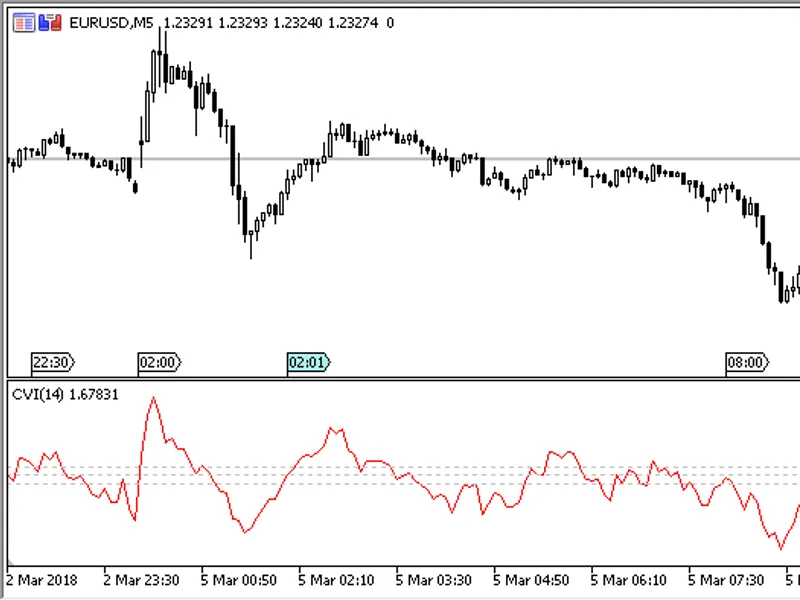
The CV Indicator is an oscillator that displays the price deviation from the moving average, considering the Average True Range (ATR).Calculation Formula:CVI = (Close – MA) / ATRMo...