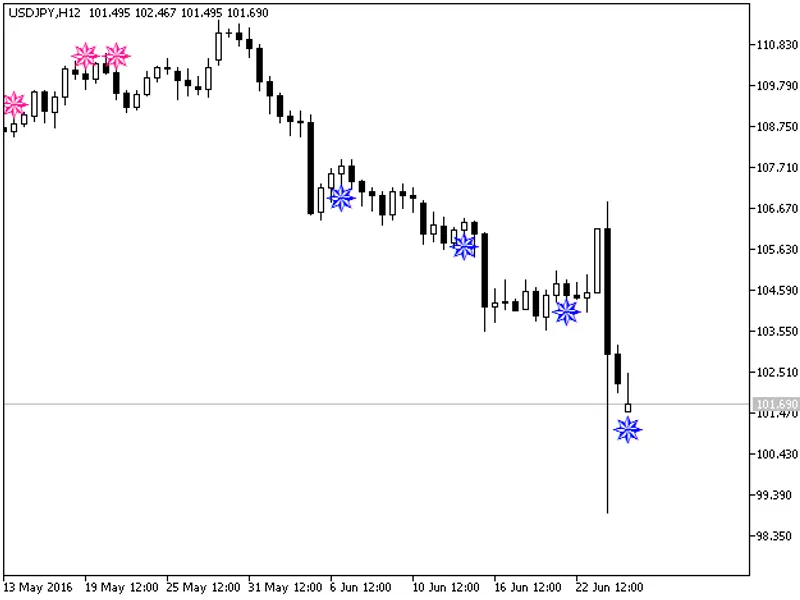
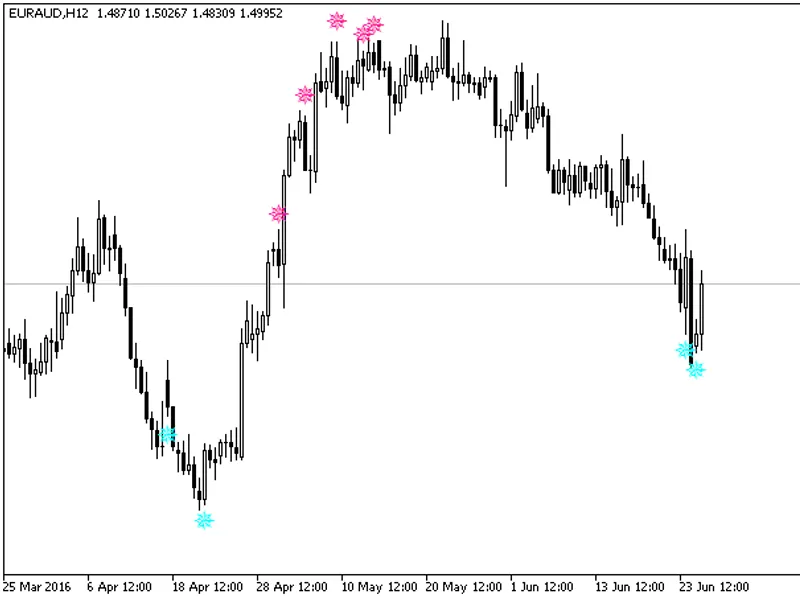
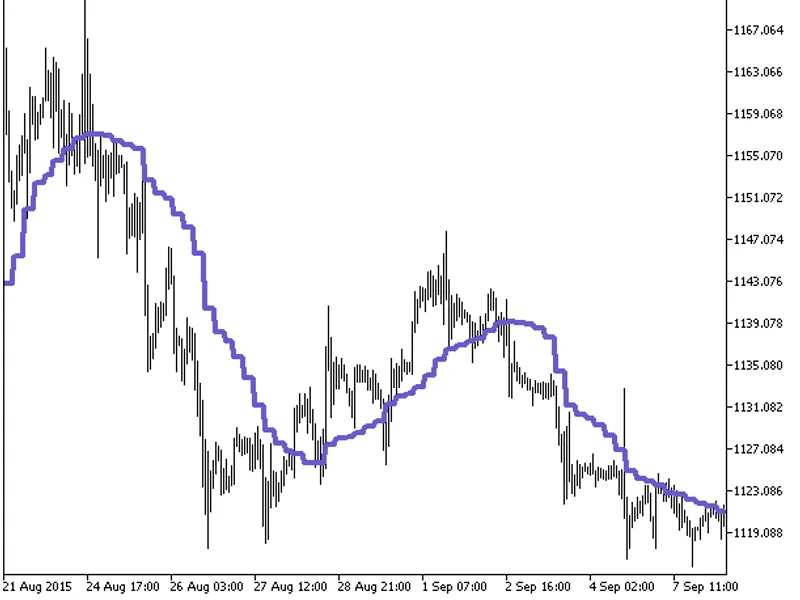
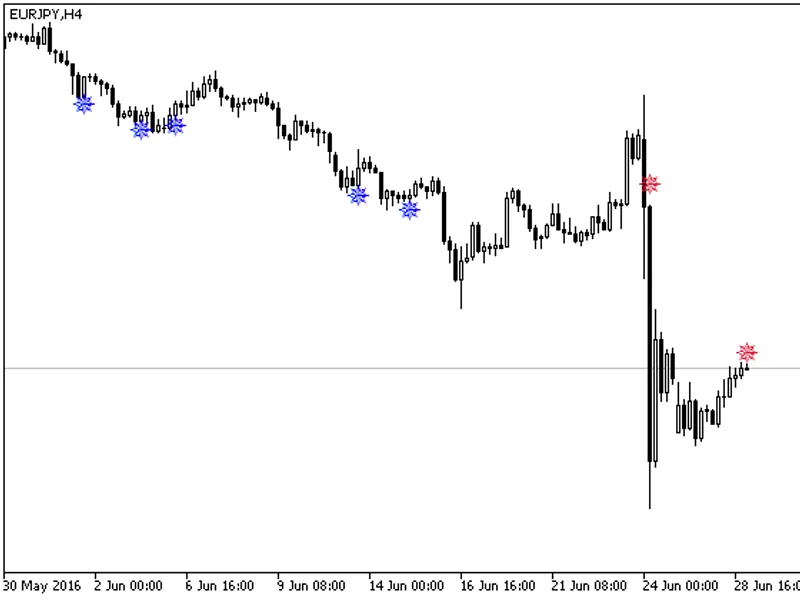
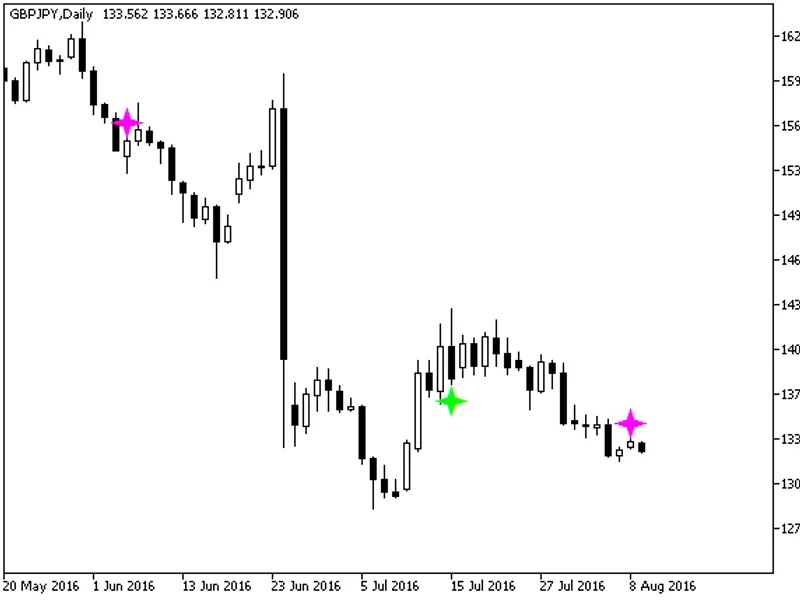
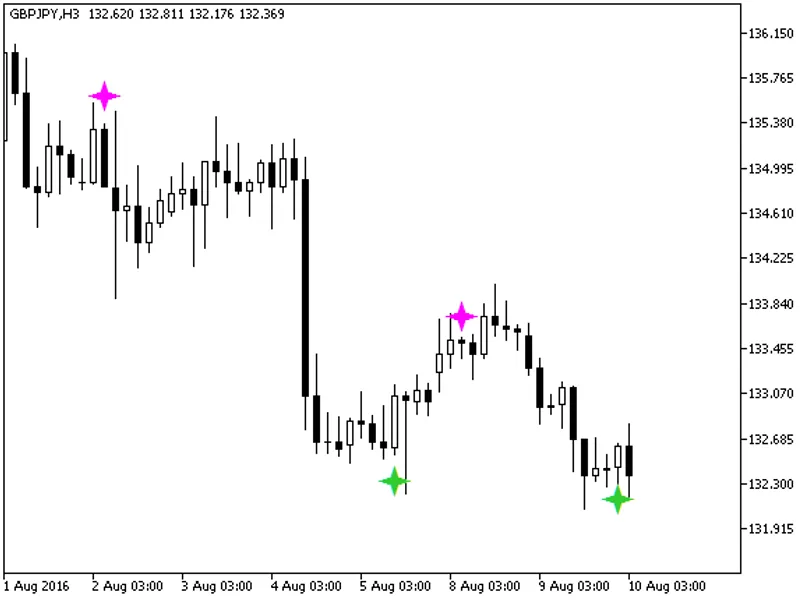
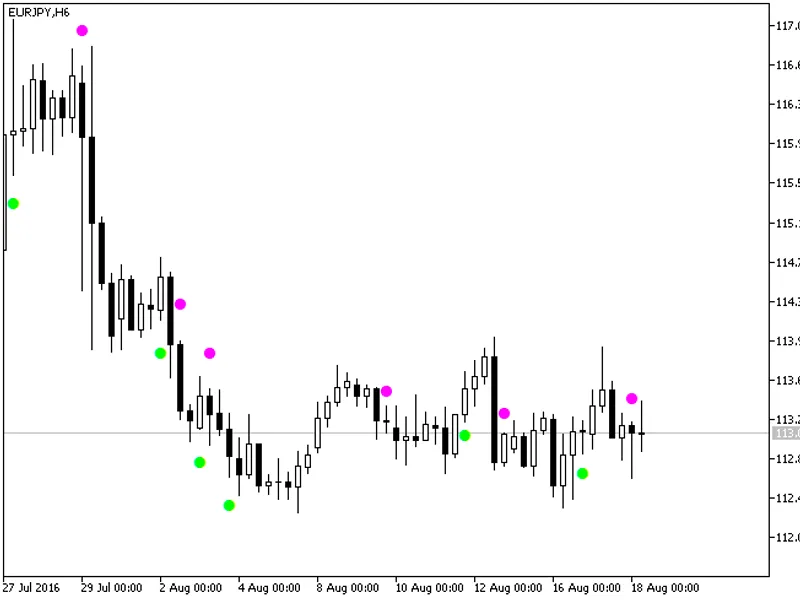
This indicator introduces new input parameters and enhances functionality with three additional functions: buysignal(), sellsignal(), and getstringtimeframe().The indicator code no...
This indicator has been updated with new input parameters and functions.Three new functions have been added to the end of the indicator code: buysignal(), sellsignal(), and getstri...
The exp_volume_weighted_ma Expert Advisor is designed to react to changes in the direction of the indicator. It generates signals when a bar closes and the indicator line changes c...
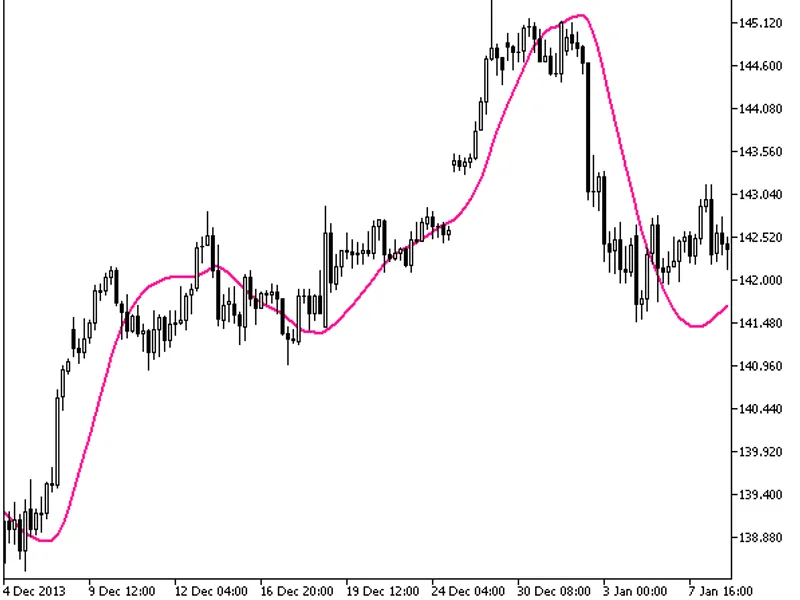
This indicator offers a timeframe selection feature in its input parameters.To use this indicator, you'll need the volume_weighted_ma.mq5 file. Place it in the following directory:...
This indicator has been updated with new input parameters and functions to enhance its capabilities.Three new functions have been added to the indicator code: buysignal(), sellsign...
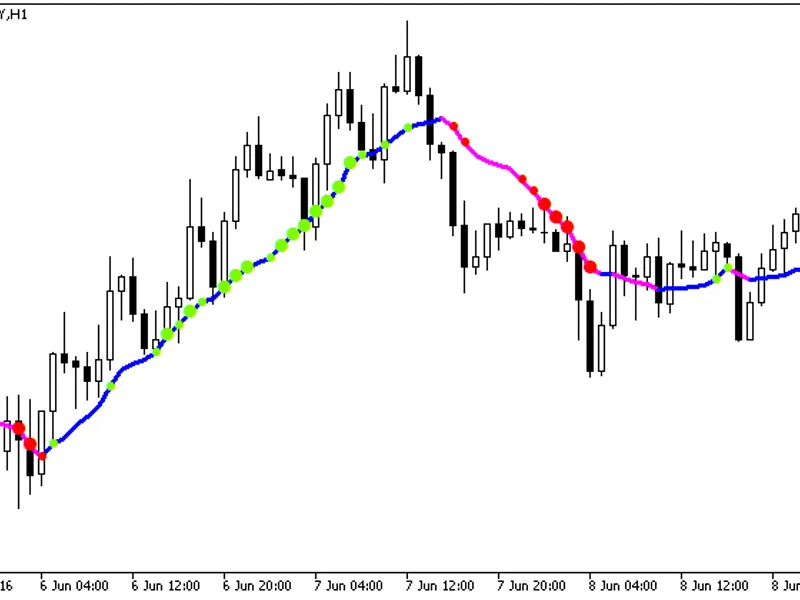
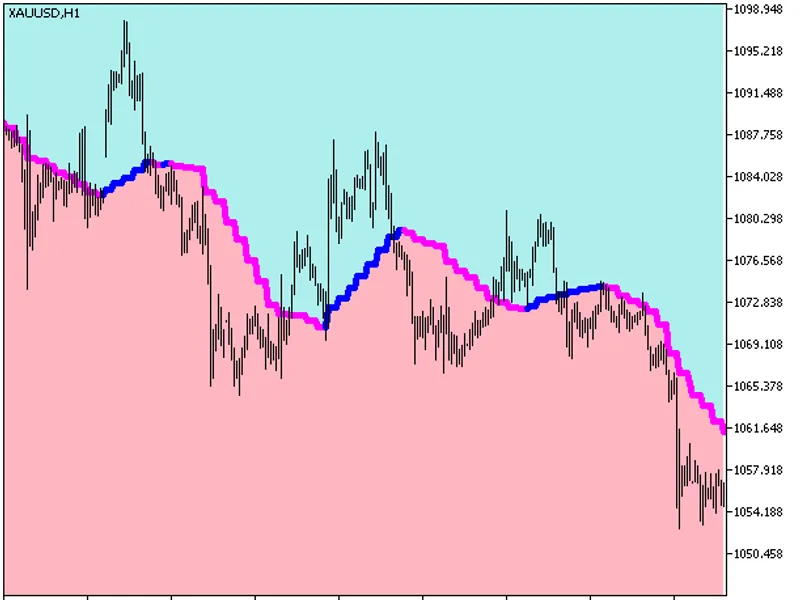
Statbars to the indicator with additional trend strength indication using colored dots based on the standard deviation algorithm.If the standard deviation of the volume_weighted_ma...
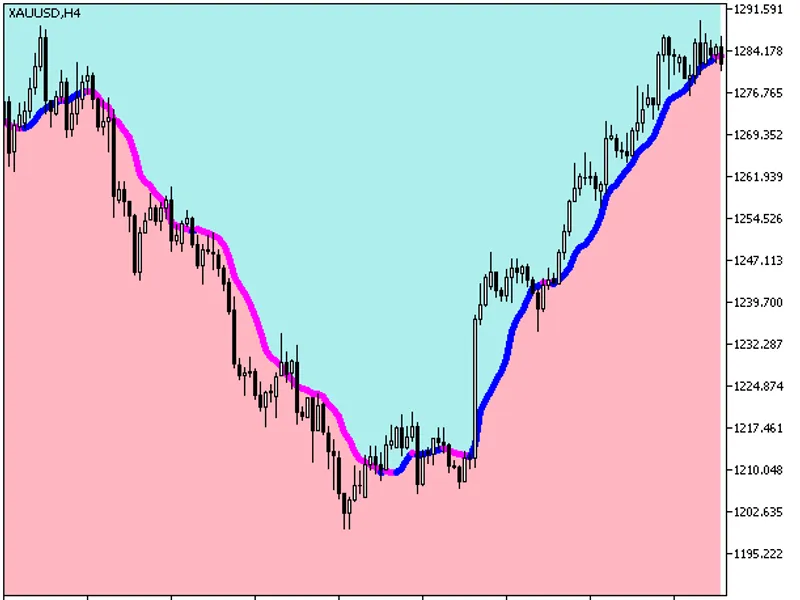
The Volume Weighted MA Cloud indicator is a powerful tool that enhances the standard moving average by incorporating volume data. It calculates a volume-weighted moving average and...
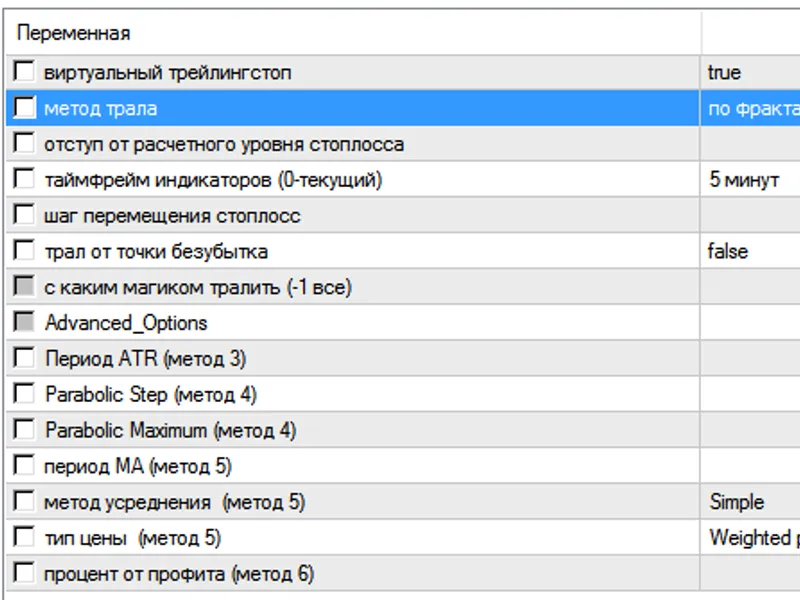
This Expert Advisor is designed to work in both normal and hedge modes, supporting multiple positions.It offers a versatile trailing stop feature that can be based on various indic...
KomposterThis indicator introduces new input parameters and enhances functionality with three new functions: buysignal(), sellsignal(), and getstringtimeframe().The buysignal() and...
The indicator with the timeframe selection option in the input parameters.This indicator requires the volume_weighted_ma_cloud.mq5 indicator file. Place it in <terminal_data_fol...
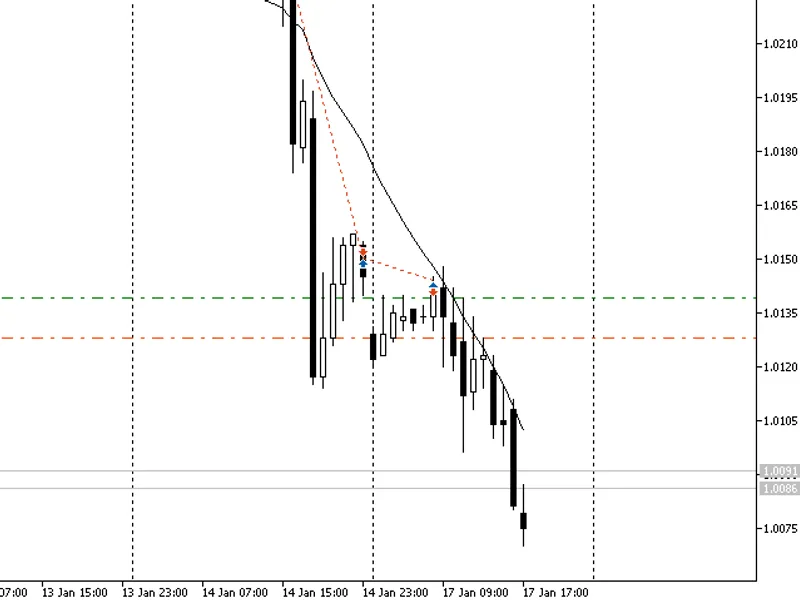
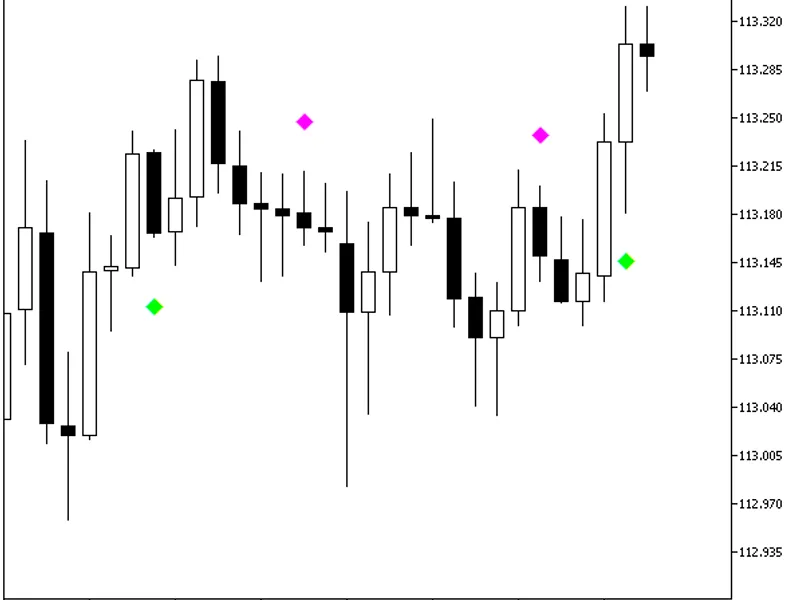
Trading system based on indicator signals. A signal is formed at the close of a bar if a color point of the indicator has appeared. Market exit signal is generated if the indicator...
This Expert Advisor (EA) is designed for the USD/JPY currency pair on the H4 timeframe, utilizing various indicators such as ADX, Stochastics, and Accelerator.The EA incorporates c...
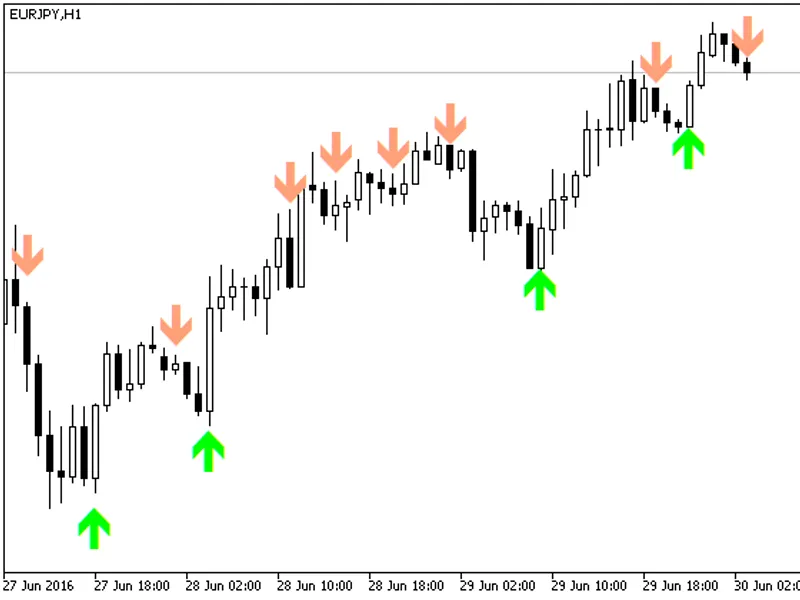
This indicator offers a straightforward method to determine the current direction of a currency pair. As seen in the image, the last line provides clear buy or sell signals. By add...
This tool is designed to record tick data in a structured format, capturing datetime, bid, ask, and volume information.Key features:- Continuous recording: The recorder operates pe...
The indicator places a panel on your chart that displays 5 economic events from the Forex Factory calendar. You can filter events by high, medium, or low impact, speeches, holidays...
This indicator calculates the profit or loss of current orders on a symbol. You can drag and drop lines to display the current profit or loss.Parameters:- To count in money or pips...
The SAR Trading System demonstrates the functionality of the Stop and Reversal (SAR) indicator, originally designed by Welles Wilder. This expert advisor monitors open positions an...
The indicator offers a timeframe selection feature in its input parameters.Note: The indicator requires the ravi_histogram.mq5 file, which should be placed in \mql5\indicators.Fig....
An alternative to the Bollinger Bands® channel, this indicator features a colored inner area within the channel.The original indicator was written in MQL4 and first published in 20...
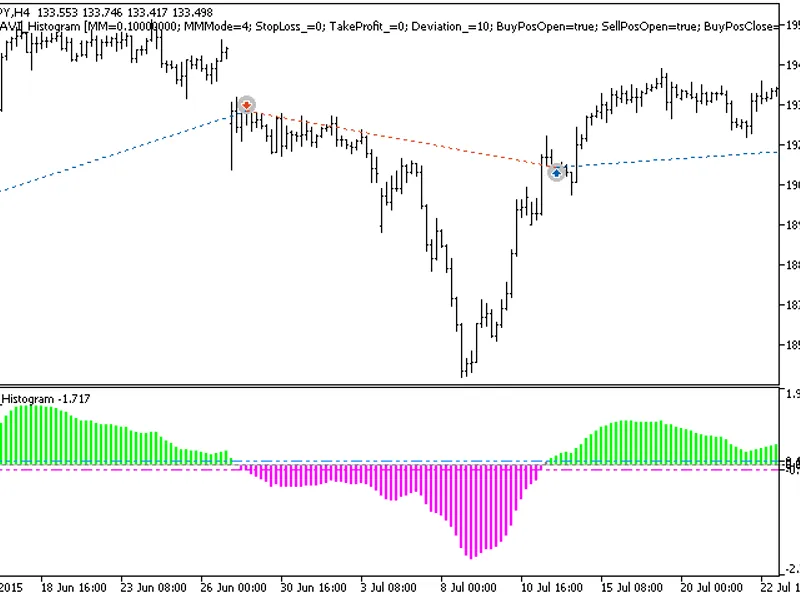
The EXP RAVI Histogram Breakout Trading System is a strategy based on the signals of the oscillator. The signal is generated when a bar is closing, and the indicator breaks through...
RobofxThis indicator presents a color histogram that displays the strength and direction of the current trend. The histogram is colored based on the input parameters for overbought...
This indicator introduces new input parameters and additional functionality.Three new functions have been added to the indicator code: buysignal(), sellsignal(), and getstringtimef...
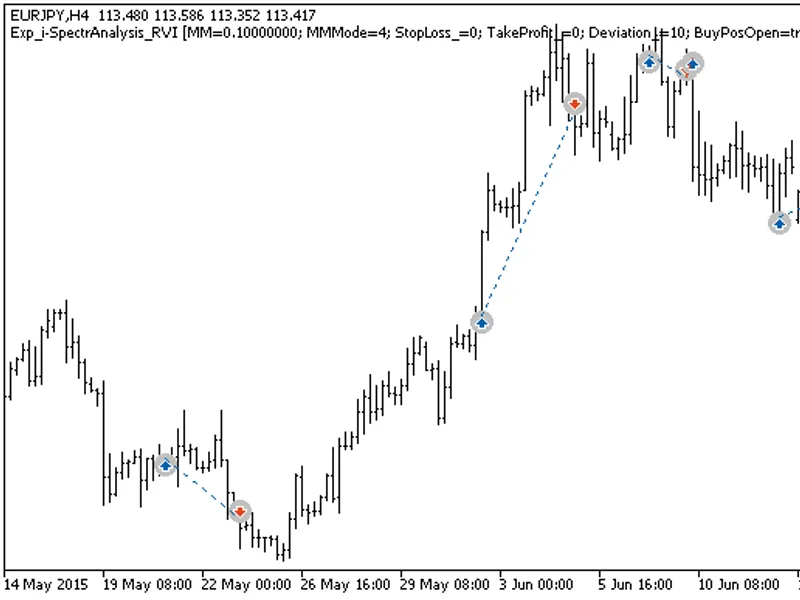
The Exp_I-Spectranalysis_RVI EA is based on signals generated by the oscillator. The signal is formed when a bar is closing if there is a crossing of the main and signal lines of t...
An instance of this class provides access to various price-related values, including bid, ask, high, low, close, and open prices for the current or specified candle. It also retrie...
DSS Bressert Sign Alert Indicator
New input parameters have been introduced.
Three new functions have been added to the end of the indicator code: buysignal(), sellsignal(), and ...
The indicator displays candlesticks of a higher timeframe as color-filled rectangles, with colors based on indicator values.Candlestick bodies are colored emerald green or purple, ...
The Exp_I-Spectranalysis_WPR Expert Advisor is designed to react to changes in the direction of the indicator. It generates a signal when a bar closes if there is a color change in...
WellxThis indicator has been updated with new input parameters and additional functionality.Three new functions have been added to the indicator code: buysignal(), sellsignal(), an...
This expert advisor is a trading system based on indicator signals. A signal is generated at the close of a bar when a color icon of the indicator appears.To run this expert adviso...
Deso'reganThis indicator calculates the smoothed difference between the main and signal lines of the Stochastic Oscillator, presenting it as a colored histogram.The indicator utili...
Deso'reganThis indicator displays the smoothed difference between the main and signal lines of the RVI oscillator as a colored histogram.The indicator utilizes the SmoothAlgorithms...
The indicator offers a timeframe selection feature in its input parameters.Note: The indicator requires the xtrendlessos.mq5 indicator file. Place it in \mql5\indicators.Fig. 1: Xt...
The XPFE Indicator with Timeframe SelectionThis indicator offers the flexibility to choose the timeframe in the input parameters.Note: The indicator requires the XPFE.mq5 file. Ens...
During execution, slippages introduce non-systematic profit/loss.This script calculates and displays these slippage values in the account currency.It allows for the assessment of t...
The STLM digital filter implemented as a sequence of candlesticks. Candlesticks are generated by applying the ColorSTLM_Histogram indicator algorithm to relevant price time series....
This indicator is a hybrid of the Slow Adaptive Trend Line (SATL) digital filter and the JMA adaptive smoothing algorithm.The average is calculated as follows:where:SATL() — value ...
The AFL Winner indicator provides a visual representation of indicator entries into overbought and oversold areas using color-coded histograms. Pale histogram tones indicate a simp...
The XChannel HTF indicator offers a unique feature: the ability to select the timeframe directly from the input parameters.To utilize this indicator, ensure you have the xchannel.m...
The ATR Channels HTF indicator offers a unique feature: the ability to select the timeframe.This indicator requires the atr_channels.mq5 file, which should be placed in the <ter...
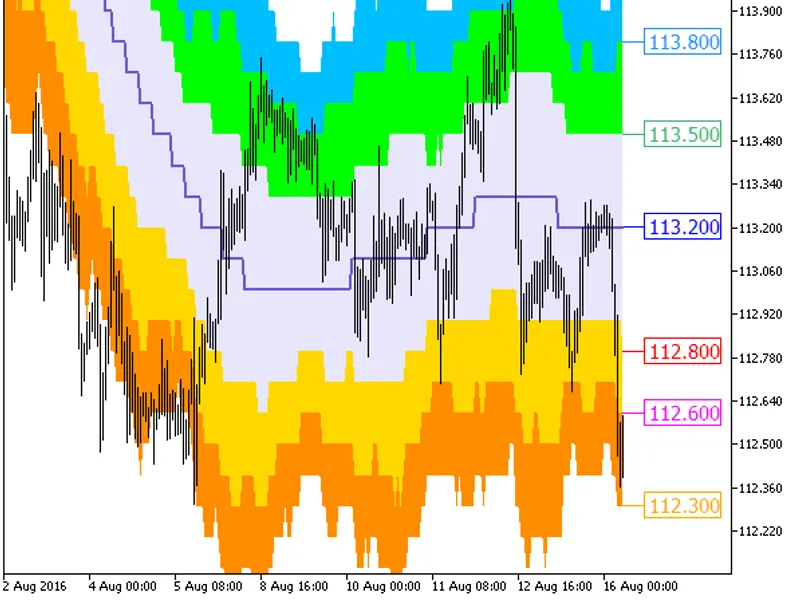
Three channels using the ATR indicator, based on one moving average, drawn as a colored cloud, with the display of the last values as price labels and the option to round channel l...
The MACD histogram, based on the FATL and SATL digital filters with color indication of trends.The indicator uses SmoothAlgorithms.mqh library classes (copy it to \mql5\include).Fi...
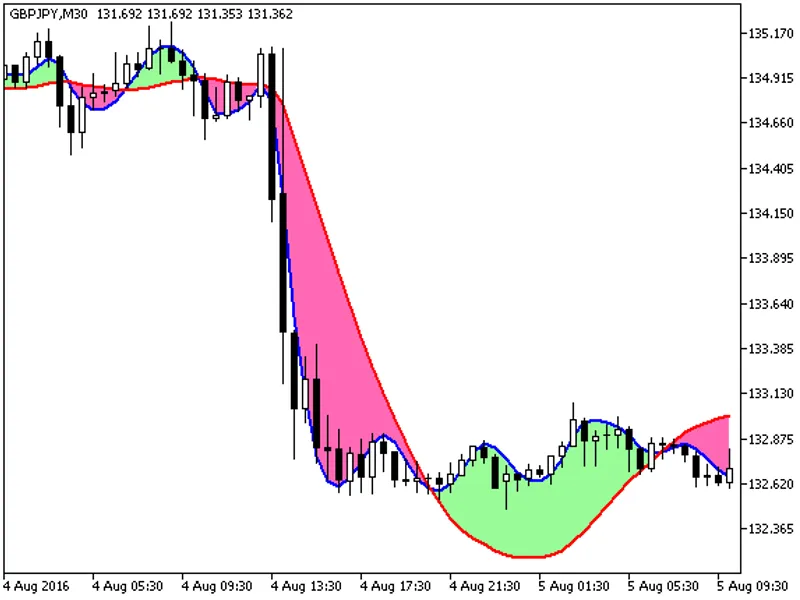
This indicator is based on smoothed Fatl and Satl digital filters and the signal trend cloud between them.The indicator utilizes the smoothalgorithms.mqh library classes, which sho...
This lightweight cross-platform library enables efficient and rapid comparison of 'double' values for the 'price' variable.For instance, prior to executing a selllimit order, it ca...
This indicator introduces new input parameters and additional functionality to the original Elliott Wave Oscillator.New functions added: buysignal(), sellsignal(), and getstringtim...
A simple trend indicator that calculates the rise and fall in high and low prices.Calculation formula:i4_drf_v2=100 * (psum - nsum) / periodwhere:psum — the number of candles in th...
The BS Living Now indicator identifies market extremums, resembling the standard fractals indicator. While similar in appearance, they differ in their underlying calculations and f...