Trendline zigzag in qualitative channel
This is a powerful addition to your MetaTrader 5 toolkit designed to optimize market analysis and performance. This technical indicator acts as a specialized analysis tool designed to visualize market data. It helps traders identify emerging trends, momentum shifts, and key support or resistance levels by plotting statistical calculations directly onto price charts.
How to Setup and Use Trendline zigzag in qualitative channel
1. Installation: Place your file in the MQL/Indicators folder via "Open Data Folder" and restart your terminal.
2. Loading: Find the indicator in the Navigator, drag it onto your chart, and configure the input parameters in the popup window.
3. Customization: Press Ctrl+I to open the indicator list, select your tool, and click "Properties" to change colors, levels, or visual styles.
4. Updating: Replace the old file in the Indicators folder with the new version and restart the platform to apply changes.
Frequently Asked Questions
Q: Why is my indicator not showing? A: Verify the file is in the MQL/Indicators folder, or try right-clicking the "Indicators" tree in the Navigator and clicking "Refresh."
Q: Do custom indicators slow down the platform? A: Too many complex indicators can impact performance; remove unused ones via the "Indicator List" (Ctrl+I).
Q: Can I use MT4 indicators on MT5? A: No, MQL4 and MQL5 are distinct languages; ensure the indicator is compiled specifically for your platform version.
Description & Settings
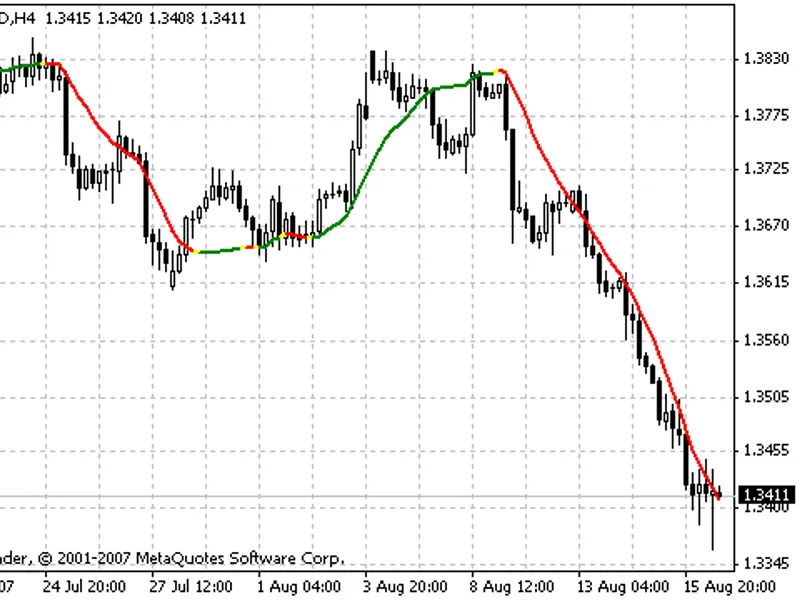
This indicator is as an evolution of the classic Donchian channel.
Pivots are identified using a zigzag structure and graphical markers, with the pivots derived entirely from the behaviour of the channel. A pivot is triggered when the channel flattens, forming a connector point for the next zigzag leg. To avoid weak or insignificant pivots, a depth parameter is used to confirm the channel’s flatness before marking a new pivot. The pivot logic is intentionally kept simple, with no forward correction applied. As a result, there is some inherent lag due to the need for confirmation.
To make the indicator more useful in live trading, the current "live" leg is drawn as a dynamic trendline from the most recent confirmed pivot to the current price extreme. This trendline remains valid until a new pivot is confirmed. The result is a continuously updating cycle of trendlines, which enhances the visual interpretation of the channel and provides an analytical advantage.
The purpose of this indicator is to observe whether price action respects the trendline by reacting to it with a bounce, or disrespects it, by altering it and prompting a shift in direction. This tool provides qualitative insight rather than precise signals, so it should not be used to predict exact market movements or serve as a standalone decision-making tool.
-----