Wave Weis Bar Force
This is a powerful addition to your MetaTrader 5 toolkit designed to optimize market analysis and performance. This technical indicator acts as a specialized analysis tool designed to visualize market data. It helps traders identify emerging trends, momentum shifts, and key support or resistance levels by plotting statistical calculations directly onto price charts.
How to Setup and Use Wave Weis Bar Force
1. Installation: Place your file in the MQL/Indicators folder via "Open Data Folder" and restart your terminal.
2. Loading: Find the indicator in the Navigator, drag it onto your chart, and configure the input parameters in the popup window.
3. Customization: Press Ctrl+I to open the indicator list, select your tool, and click "Properties" to change colors, levels, or visual styles.
4. Updating: Replace the old file in the Indicators folder with the new version and restart the platform to apply changes.
Frequently Asked Questions
Q: Why is my indicator not showing? A: Verify the file is in the MQL/Indicators folder, or try right-clicking the "Indicators" tree in the Navigator and clicking "Refresh."
Q: Do custom indicators slow down the platform? A: Too many complex indicators can impact performance; remove unused ones via the "Indicator List" (Ctrl+I).
Q: Can I use MT4 indicators on MT5? A: No, MQL4 and MQL5 are distinct languages; ensure the indicator is compiled specifically for your platform version.
Description & Settings
WaveWeisBarForce
is an indicator that applies the logic of volume waves (Weis) to identify accumulations and changes in market direction. It adds up the volume while the trend remains unchanged. When the direction changes, it starts a new wave and resets the accumulation to zero. Intensity is calculated by levels, according to the ratio between the volume of the current wave and the largest recent accumulation ( Intensity window).
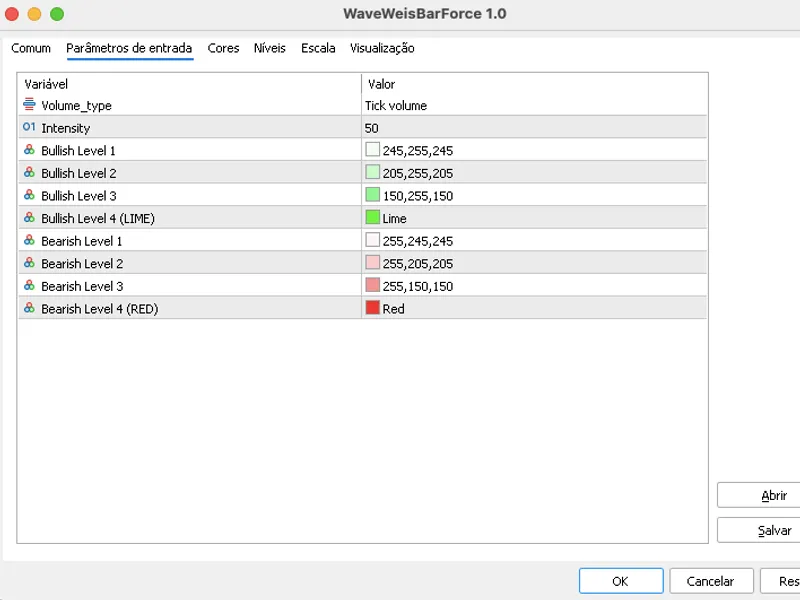
Input parameters
Volume_type
- Defines the volume source (tick or real).
Intensity
- Bar window used for intensity reference.
Bullish Levels (1 to 4)
- Scale of green, from lightest to
LIME
.
Bearish Levels (1 to 4)
- Red scale, from lightest to
RED
.
Example of the input parameters screen:
Visual interpretation
Bullish Levels
Level 1: Very light green (low intensity wave).
Level 2: Light green.
Level 3: Medium green.
Level 4:
LIME
(maximum intensity bullish wave).
Bearish Levels
Level 1: Very light red (low intensity wave).
Level 2: Light red.
Level 3: Medium red.
Level 4:
RED
(maximum intensity bearish wave).
WaveMax (white)
- Marks the bar with the highest volume within the current wave.
WaveClimax (yellow)
- Marks when the current wave's accumulation exceeds the best historical accumulation.
Example of the indicator applied to the chart:
Notes
Only the current cumulative value is displayed in the legend.
WaveMax and WaveClimax are hidden by default to keep the reading clean.
The indicator is suitable for any asset and timeframe, and is especially useful for intraday studies.