


Vertical histograms constructor
Info
The Vertical histograms constructor is a Library for MetaTrader 5 that a histogram is a bar chart of frequencies. One of the axes represents variable values, while another — the frequency of these values' occurrence.
Usage
This tool is typically used for enhancing chart analysis and decision making.
Platform
This Library works exclusively on MetaTrader 5 (both build 600+ and newer versions).
Setup
Place the downloaded file in MQL5/Libraries folder via File ? Open Data Folder in MetaTrader 5.
How to Install and Use Vertical histograms constructor
1. Storage: Place library files in the MQL/Libraries directory to ensure they are accessible to your projects.
2. Implementation: Include the library in your code using the #import directive, ensuring you match the exact function names and parameters.
3. Compilation: Ensure the library is present in the directory before you compile your main EA or script, as the compiler links them during this phase.
4. Management: Keep libraries organized in sub-folders if you manage many custom functions to maintain a clean project structure.
Frequently Asked Questions
Q: What is a library file used for? A: Libraries store reusable code modules, allowing you to centralize common logic used by multiple EAs or indicators.
Q: Is a library executable? A: No, libraries are non-executable files containing functions; they must be imported into an EA, indicator, or script to function.
Q: Can I update a library while the platform is running? A: You should compile your EA or script after updating a library to ensure the latest code changes are integrated.
What this tool does
A histogram is a bar chart of frequencies.
Typical Use Case
This Library excels in automated trading and technical analysis on MetaTrader 5.
Compatible Platform & Setup
This Library works on MetaTrader 5. Place the file in the MQL5/Libraries folder and restart the terminal.
Description & Settings
Related: CS V file reader for MQ L5 - another powerful library for MetaTrader 5 traders.
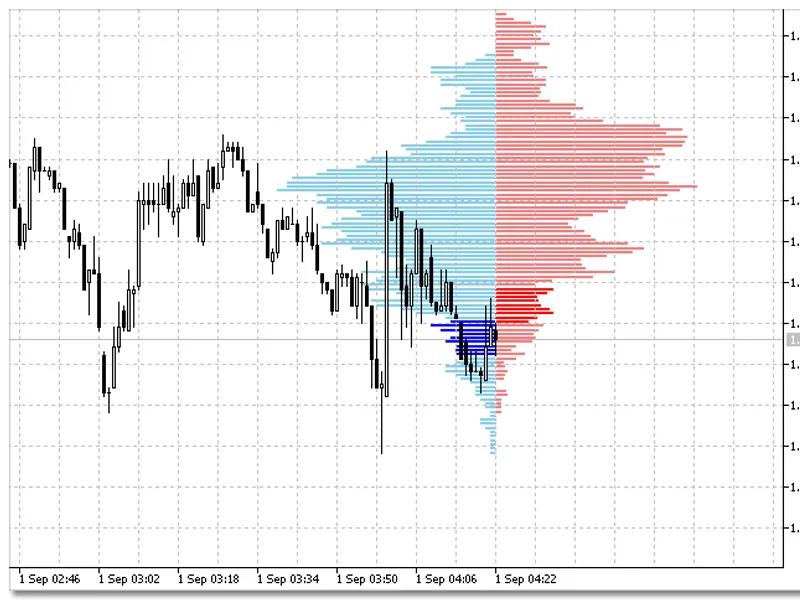
A histogram is a bar chart of frequencies. One of the axes represents variable values, while another — the frequency of these values' occurrence. The height of each bar shows the frequency (number) of values belonging to the respective interval equal to the column width. Such diagrams are usually displayed horizontally, i.e. variable values are located on a horizontal axis, while frequency — on a vertical one.
Also recommended: Trading signals module based on Candles Smoothed indicator - similar library with strong performance on MetaTrader 5.
In this library, we will focus on the vertical histograms of the order statistics: price values of the analyzed parameters are to be located on the vertical axis in ascending order, while frequency is to be located on the horizontal axis. Incoming price data are distributed and grouped on the current bar and can be displayed relative to its axis from the left, right or both sides simultaneously.Fig. 1. Vertical histogram of Bid and Ask prices distribution.
Constructor of vertical histograms is based on the
CHistogram
class. Implementation of all its methods are based on the use of so-called "graphic" memory.
Method: class constructor
CHistogram
.
Initializes an instance of the class.
void CHistogram( string name, // unique name prefix int hsize, // chart scale int width, // width of the histogram line bars color active, // color of the active line bars color passive, // color of the passive line bars bool Left_Right=true, // left=false or right=true bool relative_frequency=false, // relative or absolute histogram int sub_win=0 // index of the window for plotting histogram );
Parameters:
name
[in] The unique name prefix for the columns of the histogram.
hsize
[in] The scale of the histogram display.
width
[in] The width of the histogram line bars
active
[in] The color of the histogram columns updated on the current bar.
passive
[in] The color of the histogram columns not updated on the current bar.
Left_Right=true
[in] The direction of the histogram display. false — histogram to the left of the current bar, true — to the right.
relative_frequency=false
[in] The method of accounting the frequency values. false — absolute frequency values, true — relative frequency values.
sub_win=0
[in] The index of the window for plotting the histogram. 0 — main chart window.
Returned value:
No return value. If successful, it creates an instance of the class with the specified parameters.
Method: histogram display
DrawHistogram
.
Displays the histogram bars: creates new bars; edits existing bars; stores the frequency values to the graphic memory; displays the histogram on the current bar.
void DrawHistogram( double price, // value of the variant datetime time // time of the current bar );
Parameters:
price
[in] Value of the variant of the studied market characteristics.
time
[in] Time of the current bar. This bar will be the histogram axis.
Returned value:
No return value. If successful, creates new or adjusts existing histogram column. If a new bar appeared, the histogram is shifted so that the axis is on the current bar.
Method: calculation of the histogram characteristics
HistogramCharacteristics
.
Returns the calculated characteristics of the order statistic in a variable of type sVseries.
sVseries HistogramCharacteristics();
Parameters:
No input parameters.
Returned value:
If successful, it returns the value of a variable of type sVseries.
Structure for getting the current values of the histogram characteristics (
sVseries
).
Structure for storing past values of the characteristics of the statistical distribution. Designed for getting the most demanded information on the order statistic.
Variable of
sVseries
type allows to obtain the values of all main characteristics of the order statistic displayed as a histogram by using a single call to the
HistogramCharacteristics()
function.
Method: visualization of the mean value
DrawMean
.
Displays the value of the weighted arithmetic mean of order statistic on the chart.
void DrawMean( double coord, // value of the weighted arithmetic mean datetime time, // time of the current bar bool marker=false,// display the marker or not bool save=false // store the value to history or not );
Parameters:
coord
[in] The value of the weighted arithmetic mean.
time
[in] Time of the current bar. The value of the weighted arithmetic mean will be measured on this bar.
marker=false
[in] Display marker on the chart or not. false — marker is not displayed, true — marker is displayed on the chart.
save=false
[in] Store the value of the weighted arithmetic mean to history. false — do not display, true — display the value on the chart.
Returned value:
If successful, a horizontal line is displayed on the chart, which corresponds to the value of the weighted arithmetic mean.
Method: visualization of the standard deviation
DrawSD
.
Displays the value of standard deviation as a rectangle. The rectangle width matches the average frequency and its height matches the standard deviation plotted up and down of the weighted arithmetic mean value.
void DrawSD( sVseries &coord, // variable of type sVseries datetime time, // time of the current bar double deviation=1.0, // deviation color clr=clrYellow // display color );
Parameters:
coord
[in] The value of a variable of type sVseries.
time
[in] Time of the current bar.
deviation=1.0
[in] Coefficient to increase the value of the standard deviation.
clr=clrYellow
[in] Color of the rectangle that visualizes the standard deviation.
Returned value:
If successful, displays a rectangle on the chart, which characterizes the standard deviation from the value of the weighted arithmetic mean.
Capabilities of the class are demonstrated in the video. Code of the test sample is provided in the attachment.
The provided code shows how to call a particular method (function) of the class.
Tips:
It is better to use the class on the smaller timeframes.
You may also like: Bridge - structural design pattern - excellent alternative for library users on MetaTrader 5.
⚠ Limitations & Risk Warning
- This tool is provided for educational and testing purposes only.
- Past performance does not guarantee future results.
- Trading involves substantial risk of loss. Use on a demo account first.
- Results may vary depending on market conditions, broker, and settings.
- We recommend thorough backtesting and forward testing before using with real funds.