Strategy report output into a chart
This tool for MetaTrader 5 is specifically engineered to streamline your trading operations. This script functions as a utility program designed for specific, one-time execution tasks. It is utilized to perform targeted actions, such as closing all open orders, managing chart objects, or executing custom administrative commands on demand.
How to Setup and Use Strategy report output into a chart
1. Installation: Move your script file into the MQL/Scripts directory and restart the platform.
2. Execution: Drag the script onto a chart; it will perform a one-time action, such as closing all open orders or clearing chart objects.
3. Editing: Use MetaEditor (F4) to modify code, click "Compile," and verify no errors appear in the terminal before running.
4. Removing: Scripts stop automatically, but you can remove them manually by right-clicking the chart and choosing "Remove Script."
Frequently Asked Questions
Q: How are scripts different from EAs? A: Scripts execute a single action and then stop; EAs monitor the market and trade continuously.
Q: Can I assign a hotkey to a script? A: Yes, right-click the script in the Navigator, select "Set Hotkey," and define your preferred keyboard shortcut.
Q: Why did my script stop? A: Scripts are designed to stop immediately after finishing their programmed command; this is normal behavior.
Description & Settings
This script was developed for displaying saved Strategy report from the Strategy Tester into a chart.
Follow these steps:
Put report_into_chart.mql5 into ¨\MQL5\Scripts" folder.
Compile report_into_chart.mql5 and get report_into_chart.ex5.
Unzip StrategyTester.zip and put StrategyTester.html into ¨\MQL5\Files" folder.
Refresh your Metatrader 5.
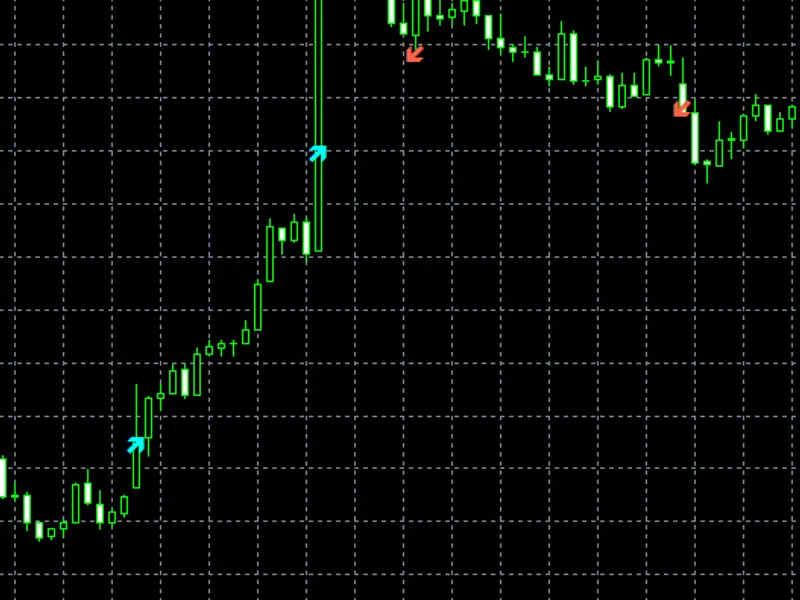
Run report_into_chart script from Metatrader and all deals will be displayed on the selected chart as blue (buy positions) or red (sell positions) arrows.
Later you can replace StrategyTester.html file with your chosen *.html report from the Strategy Tester.