Simple Average Volumes
This professional-grade solution for MetaTrader 5 helps traders achieve greater efficiency in their daily workflow. This technical indicator acts as a specialized analysis tool designed to visualize market data. It helps traders identify emerging trends, momentum shifts, and key support or resistance levels by plotting statistical calculations directly onto price charts.
How to Setup and Use Simple Average Volumes
1. Installation: Place your file in the MQL/Indicators folder via "Open Data Folder" and restart your terminal.
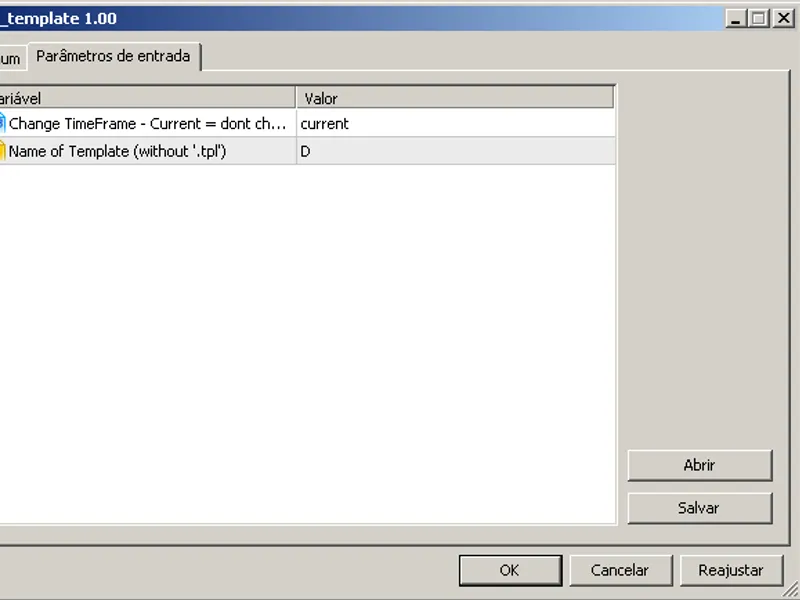
2. Loading: Find the indicator in the Navigator, drag it onto your chart, and configure the input parameters in the popup window.
3. Customization: Press Ctrl+I to open the indicator list, select your tool, and click "Properties" to change colors, levels, or visual styles.
4. Updating: Replace the old file in the Indicators folder with the new version and restart the platform to apply changes.
Frequently Asked Questions
Q: Why is my indicator not showing? A: Verify the file is in the MQL/Indicators folder, or try right-clicking the "Indicators" tree in the Navigator and clicking "Refresh."
Q: Do custom indicators slow down the platform? A: Too many complex indicators can impact performance; remove unused ones via the "Indicator List" (Ctrl+I).
Q: Can I use MT4 indicators on MT5? A: No, MQL4 and MQL5 are distinct languages; ensure the indicator is compiled specifically for your platform version.
Description & Settings
This Indicator was done to fulfill the need from EAs to check on Volume increase and decrease in a extremely simple way.All it does is calculate the average volume of a certain period of time, in candles.
It works with Tick Volume, as well as real volume.
To have your EA check if the volume has increased, just check if volume from a longer time is smaller than the volume from a shorter time... that's it ! Simple, and makes this data available to MQL5 EAs, as well as FX Dreema EAs.
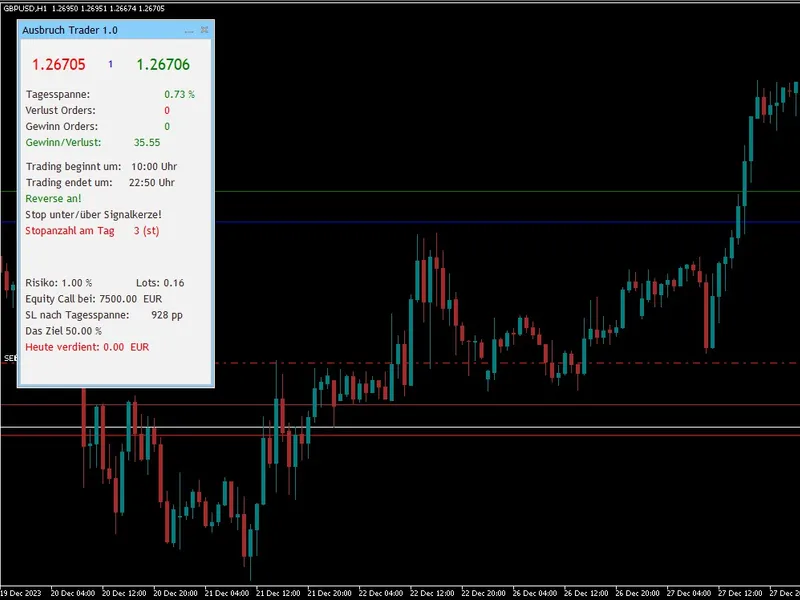
On the image above, the brokerage firm is only supplying Tick Volume, and therefore, the indicator is printing the pink line, with average tick volume.In case the brokerage firm also supplies real volume, the Blue line will represent that volume