Stochastics Overlay
This tool for MetaTrader 5 is specifically engineered to streamline your trading operations. This technical indicator acts as a specialized analysis tool designed to visualize market data. It helps traders identify emerging trends, momentum shifts, and key support or resistance levels by plotting statistical calculations directly onto price charts.
How to Setup and Use Stochastics Overlay
1. Installation: Place your file in the MQL/Indicators folder via "Open Data Folder" and restart your terminal.
2. Loading: Find the indicator in the Navigator, drag it onto your chart, and configure the input parameters in the popup window.
3. Customization: Press Ctrl+I to open the indicator list, select your tool, and click "Properties" to change colors, levels, or visual styles.
4. Updating: Replace the old file in the Indicators folder with the new version and restart the platform to apply changes.
Frequently Asked Questions
Q: Why is my indicator not showing? A: Verify the file is in the MQL/Indicators folder, or try right-clicking the "Indicators" tree in the Navigator and clicking "Refresh."
Q: Do custom indicators slow down the platform? A: Too many complex indicators can impact performance; remove unused ones via the "Indicator List" (Ctrl+I).
Q: Can I use MT4 indicators on MT5? A: No, MQL4 and MQL5 are distinct languages; ensure the indicator is compiled specifically for your platform version.
Description & Settings
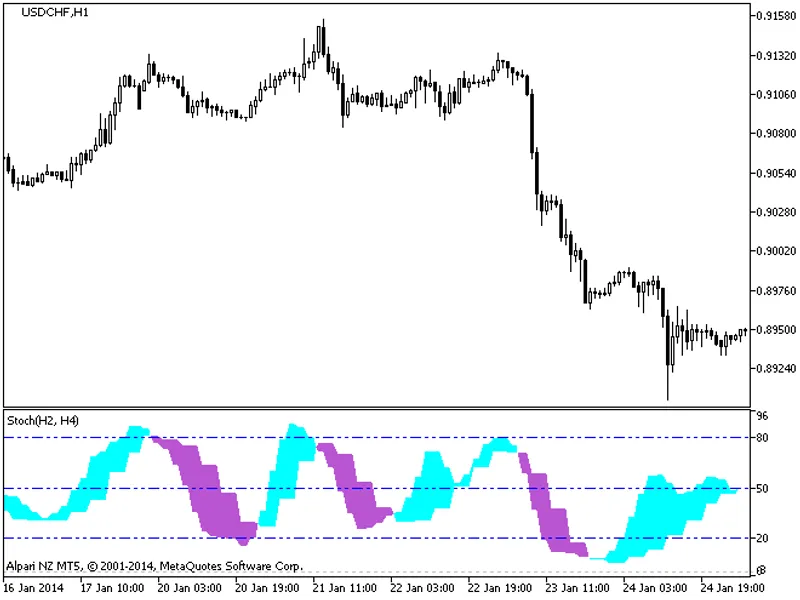
Indicator Stochastic Overlay displays the chart as colored candles in accordance with the data of oscillator Stochastic.
It has eight adjustable parameters:
Data Stochastic Compare mode
- Stochastic data comparison mode
Stochastic's main and signal lines
- Stochastic main line and signal line
Stochastic vs level 50
- Stochastic line as referred to level 50
Current and previous stochastic values
- comparing the current and previous values of the Stochastic line
Stochastic vs OB/OS levels
- Stochastic line as referred to the overbought/oversold levels
Stochastic %K period
- Stochastic %K line calculation period
Stochastic %D period
- Stochastic %D line calculation period
Stochastic slowing
- Stochastic slowing calculation period
Stochastic price field
- Stochastic calculation prices
Stochastic method
- Stochastic calculation method
Stochastic overbought
- Stochastic overbought level
Stochastic oversold
- Stochastic oversold level
Stochastic's main and signal lines:
If the main line of Stochastic is above the signal line, then the bullish candle is displayed in greenthe bearish candle is displayed in light-green
If the main line of Stochastic is below the signal line,then the bearish candle is displayed in redthe bullish candle is displayed in light-red
In all other cases, the candle is gray
Stochastic vs level 50
:
If the line of Stochastic is above level 50,then the bullish candle is displayed in greenthe bearish candle is displayed in light-green
If the line of Stochastic is below level 50,then the bearish candle is displayed in redthe bullish candle is displayed in light-red
In all other cases, the candle is gray
Current and previous stochastic values:
If the main line values of Stochastic grow,then the bullish candle is displayed in greenthe bearish candle is displayed in light-green
If the main line values of Stochastic fall,then the bearish candle is displayed in redthe bullish candle is displayed in light-red
In all other cases, the candle is gray
Stochastic vs OB/OS levels
:
If the main line of Stochastic is above the overbought level,then the bullish candle is displayed in greenthe bearish candle is displayed in light-green
If the main line of Stochastic is below the oversold level,then the bearish candle is displayed in redthe bullish candle is displayed in light-red
In all other cases, the candle is gray
Fig. 1. Stochastic Overlay + Stochastic. Data Stochastic Compare mode = Stochastic's main and signal lines
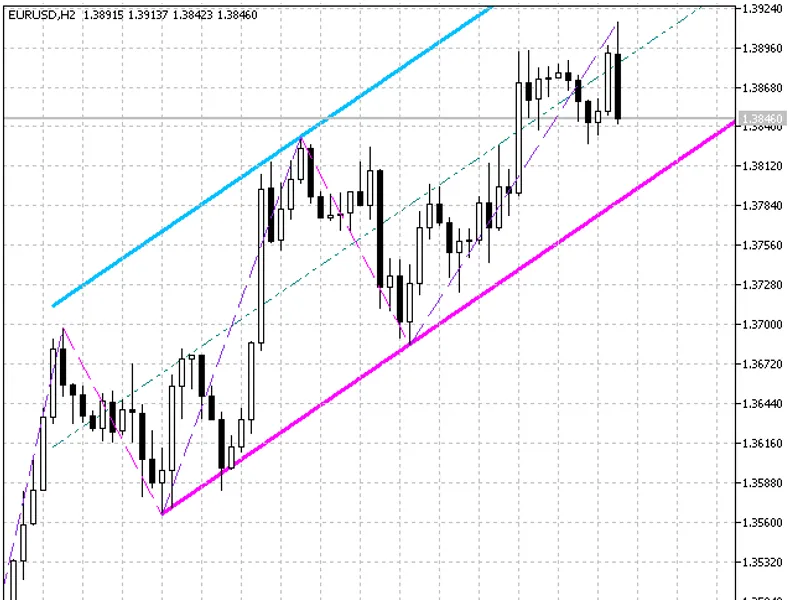
Fig. 2. Stochastic Overlay + Stochastic. Data Stochastic Compare mode = Stochastic vs level 50
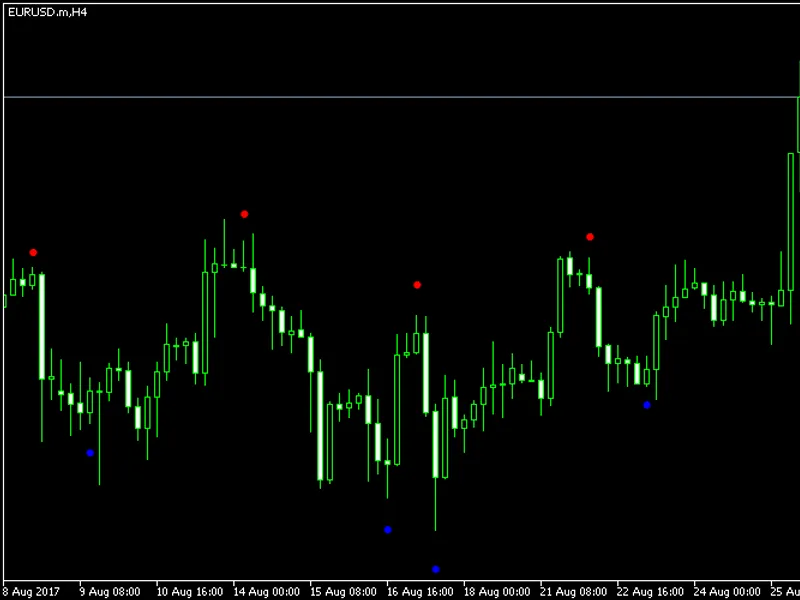
Fig. 3. Stochastic Overlay + Stochastic. Data Stochastic Compare mode = Current and previous stochastic values
Fig. 4. Stochastic Overlay + Stochastic. Data Stochastic Compare mode = Stochastic vs OB/OS levels