ZZ Color Retracement
This professional-grade solution for MetaTrader 5 helps traders achieve greater efficiency in their daily workflow. This technical indicator acts as a specialized analysis tool designed to visualize market data. It helps traders identify emerging trends, momentum shifts, and key support or resistance levels by plotting statistical calculations directly onto price charts.
How to Setup and Use ZZ Color Retracement
1. Installation: Place your file in the MQL/Indicators folder via "Open Data Folder" and restart your terminal.
2. Loading: Find the indicator in the Navigator, drag it onto your chart, and configure the input parameters in the popup window.
3. Customization: Press Ctrl+I to open the indicator list, select your tool, and click "Properties" to change colors, levels, or visual styles.
4. Updating: Replace the old file in the Indicators folder with the new version and restart the platform to apply changes.
Frequently Asked Questions
Q: Why is my indicator not showing? A: Verify the file is in the MQL/Indicators folder, or try right-clicking the "Indicators" tree in the Navigator and clicking "Refresh."
Q: Do custom indicators slow down the platform? A: Too many complex indicators can impact performance; remove unused ones via the "Indicator List" (Ctrl+I).
Q: Can I use MT4 indicators on MT5? A: No, MQL4 and MQL5 are distinct languages; ensure the indicator is compiled specifically for your platform version.
Description & Settings
The ZZ Color Retracement based on the Simple ZigZag indicator. In addition to the functionality of the base indicator, the Color Retracemnt analyzes the length of wave movements, highlighting the longer impulse movements in blue and the shorter retracements in red. Medium sized waves are highlighted in gray.
Automation of many graphical constructions, including simple ones like channels, trends (higher highs / lower lows) or Fibo grids, requires defining a "refined movement", i.e. price passing from local minimum to local maximum and from local maximum to local minimum. The ZigZag indicator is most efficient in searching for such movements, as well as in looking for local Highs and Lows.
I have already proposed a simple algorithm for searching local Highs and Lows implemented in . The main difference of from the conventional one is the much more simple and fast algorithm, as well as the single parameter — typical correction depth.
The ZZ Color Retracement indicator is the development of the idea of automating analytical ZigZag-based constructions. In particular, the indicator detects significant impulse movement and colors them in blue. Short corrective movements are shown in red, while medium flat areas are painted in neutral gray.
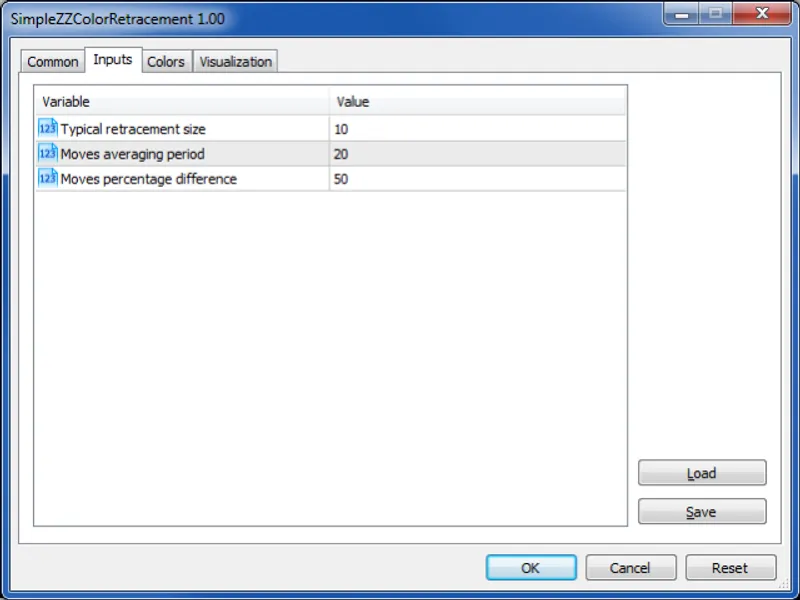
The following inputs are used to adjust the indicator:
Typical retracement size — is inherited from the parent indicator — Simple ZigZag.
Moves averaging period — number of ZigZag movements used for calculating the "average movement".
Percentage difference — the threshold ratio of the last ZigZag movement to the moving average pass. If the ratio exceeds 1 + parameter, the movement is considered to be impulse; if it is lower than 1 - parameter, the movement is considered to be corrective; if it is in the middle ([1 - parameter, 1 + parameter]), the movement is flat.
Now, that we have made ZigZag to detect impulse passes, our next step is to apply the Fibo grid.