Zoom Price tick indicator
This professional-grade solution for MetaTrader 5 helps traders achieve greater efficiency in their daily workflow. This technical indicator acts as a specialized analysis tool designed to visualize market data. It helps traders identify emerging trends, momentum shifts, and key support or resistance levels by plotting statistical calculations directly onto price charts.
How to Setup and Use Zoom Price tick indicator
1. Installation: Place your file in the MQL/Indicators folder via "Open Data Folder" and restart your terminal.
2. Loading: Find the indicator in the Navigator, drag it onto your chart, and configure the input parameters in the popup window.
3. Customization: Press Ctrl+I to open the indicator list, select your tool, and click "Properties" to change colors, levels, or visual styles.
4. Updating: Replace the old file in the Indicators folder with the new version and restart the platform to apply changes.
Frequently Asked Questions
Q: Why is my indicator not showing? A: Verify the file is in the MQL/Indicators folder, or try right-clicking the "Indicators" tree in the Navigator and clicking "Refresh."
Q: Do custom indicators slow down the platform? A: Too many complex indicators can impact performance; remove unused ones via the "Indicator List" (Ctrl+I).
Q: Can I use MT4 indicators on MT5? A: No, MQL4 and MQL5 are distinct languages; ensure the indicator is compiled specifically for your platform version.
Description & Settings
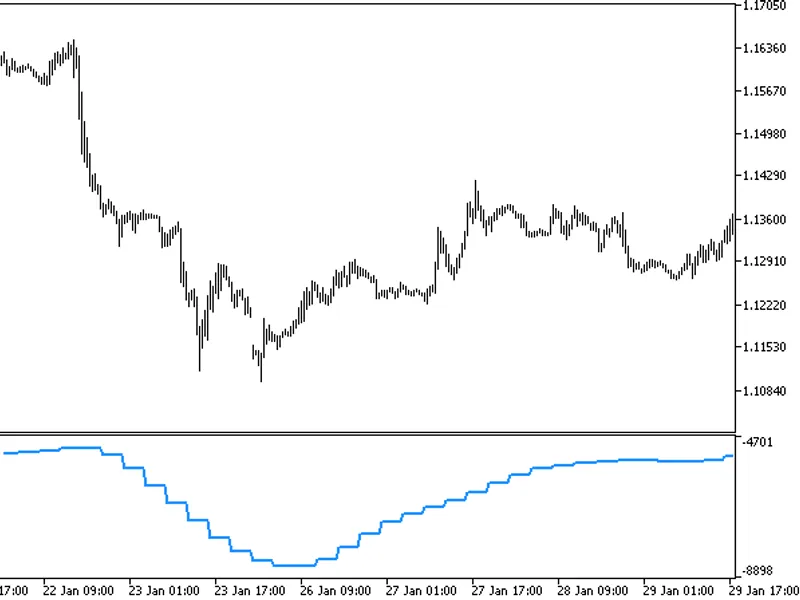
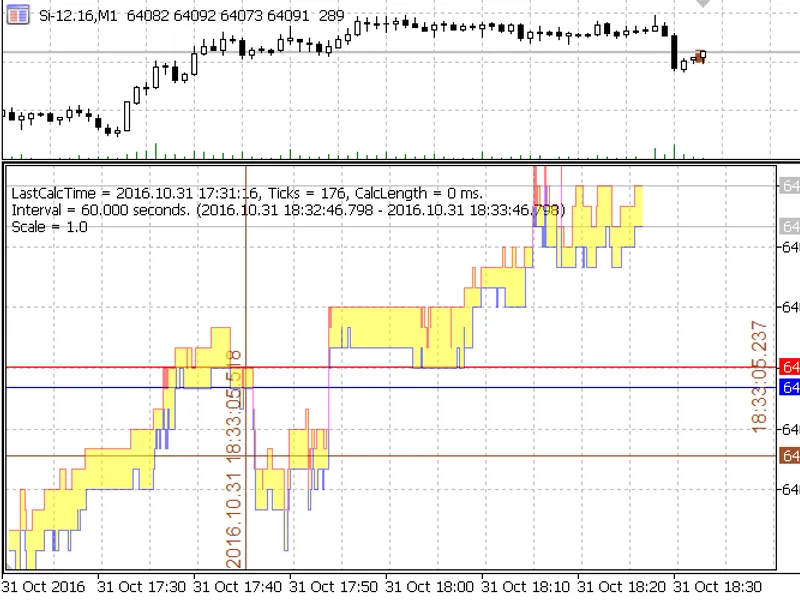
This indicator allows you to see the necessary price movement details via the convenient scale setting interface.
The indicator makes possible to view the necessary price movements from any "altitude".
The indicator interface
The left mouse button rewinds the price.
Click SHIFT to enable scaling (move the mouse).
If the cursor is on a normal price chart, clicking SHIFT displays history data located under the cursor. This simplifies the search for a necessary interval (move the mouse).
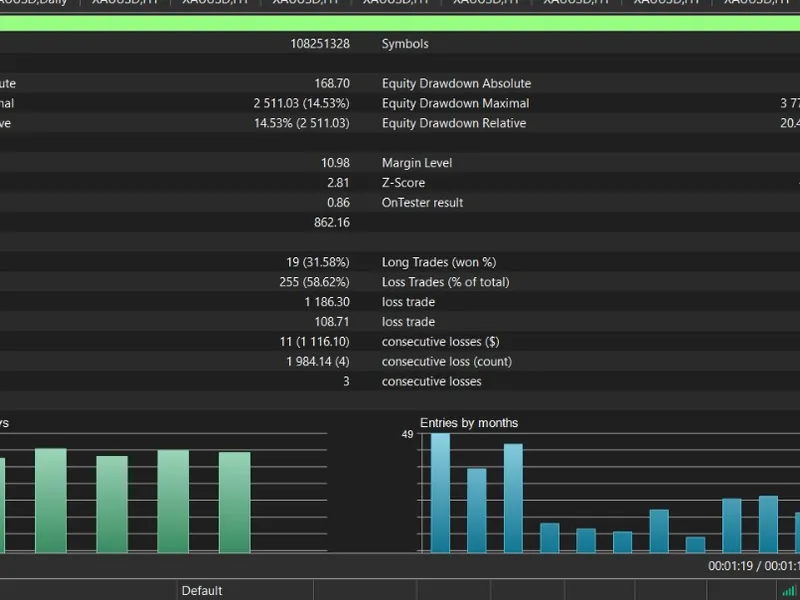
The chart is an interactive object. It can be used for any purpose, for example, as part of an EA
The EA operation results screenshot displays that this is the graphical object with the manually adjustable parameters.
The indicator is self-sufficient — do not use standard libraries.
It is compiled for MetaTrader 4, though it shows nothing in it.