Zig Zag Support and Resistance Detection
This professional-grade solution for MetaTrader 5 helps traders achieve greater efficiency in their daily workflow. This technical indicator acts as a specialized analysis tool designed to visualize market data. It helps traders identify emerging trends, momentum shifts, and key support or resistance levels by plotting statistical calculations directly onto price charts.
How to Setup and Use Zig Zag Support and Resistance Detection
1. Installation: Place your file in the MQL/Indicators folder via "Open Data Folder" and restart your terminal.
2. Loading: Find the indicator in the Navigator, drag it onto your chart, and configure the input parameters in the popup window.
3. Customization: Press Ctrl+I to open the indicator list, select your tool, and click "Properties" to change colors, levels, or visual styles.
4. Updating: Replace the old file in the Indicators folder with the new version and restart the platform to apply changes.
Frequently Asked Questions
Q: Why is my indicator not showing? A: Verify the file is in the MQL/Indicators folder, or try right-clicking the "Indicators" tree in the Navigator and clicking "Refresh."
Q: Do custom indicators slow down the platform? A: Too many complex indicators can impact performance; remove unused ones via the "Indicator List" (Ctrl+I).
Q: Can I use MT4 indicators on MT5? A: No, MQL4 and MQL5 are distinct languages; ensure the indicator is compiled specifically for your platform version.
Description & Settings
Features:
Detects key support and resistance levels using ZigZag pivot points.
Identifies high and low extremes to calculate levels.
Optional display of closed and open levels for historical analysis.
Adjustable ZigZag parameters: Depth, Deviation, and Backstep.
Interactive labels display the level type and timeframe.
Works on all standard MetaTrader symbols and intraday to daily timeframes.
Parameters:
How to Use:
A simple step-by-step guide:
Attach the indicator to a chart of your chosen symbol and timeframe.
Adjust ZigZag parameters (Depth, Deviation, Backstep) to suit your analysis style.
Choose whether to display closed levels, ZigZag line, and labels.
The indicator will display support and resistance levels and highlight clusters of pivots.
Observe the chart for areas where multiple levels converge to identify potential zones of interest.
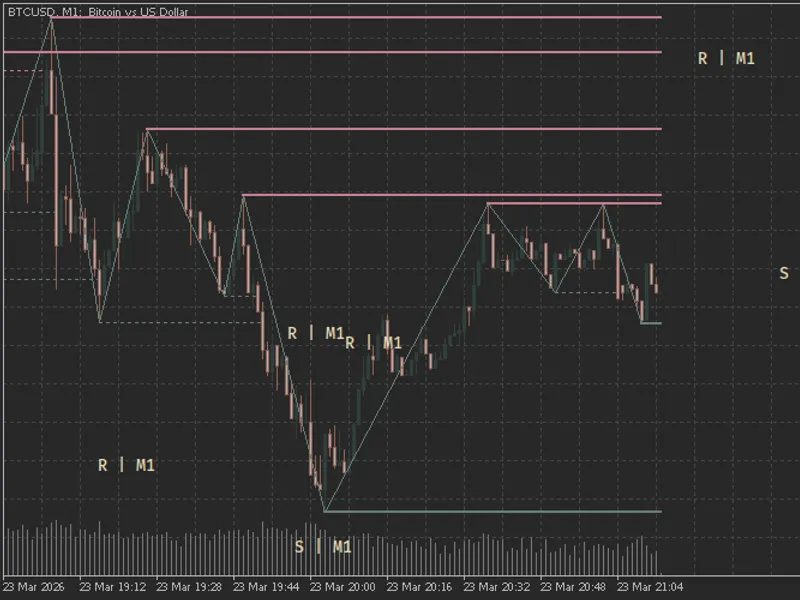
Understanding Support and Resistance Levels:
Support levels are drawn from low pivots; resistance levels are drawn from high pivots.
Open levels extend to the current bar, while closed levels have been broken.
Labels indicate the type of level (S for Support, R for Resistance) and the chart timeframe.
Screenshots:
Conclusion:
ZigZag SNR Detection provides a structured view of support and resistance levels. It helps analyze price behavior while maintaining a visual presentation of market structure.