Zig Zag On Parabolic HT F Levels
This professional-grade solution for MetaTrader 5 helps traders achieve greater efficiency in their daily workflow. This technical indicator acts as a specialized analysis tool designed to visualize market data. It helps traders identify emerging trends, momentum shifts, and key support or resistance levels by plotting statistical calculations directly onto price charts.
How to Setup and Use Zig Zag On Parabolic HT F Levels
1. Installation: Place your file in the MQL/Indicators folder via "Open Data Folder" and restart your terminal.
2. Loading: Find the indicator in the Navigator, drag it onto your chart, and configure the input parameters in the popup window.
3. Customization: Press Ctrl+I to open the indicator list, select your tool, and click "Properties" to change colors, levels, or visual styles.
4. Updating: Replace the old file in the Indicators folder with the new version and restart the platform to apply changes.
Frequently Asked Questions
Q: Why is my indicator not showing? A: Verify the file is in the MQL/Indicators folder, or try right-clicking the "Indicators" tree in the Navigator and clicking "Refresh."
Q: Do custom indicators slow down the platform? A: Too many complex indicators can impact performance; remove unused ones via the "Indicator List" (Ctrl+I).
Q: Can I use MT4 indicators on MT5? A: No, MQL4 and MQL5 are distinct languages; ensure the indicator is compiled specifically for your platform version.
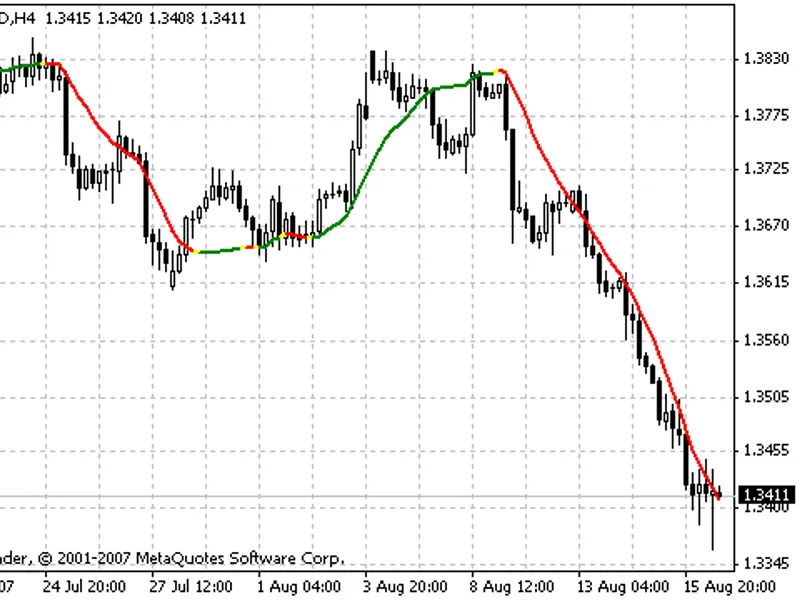
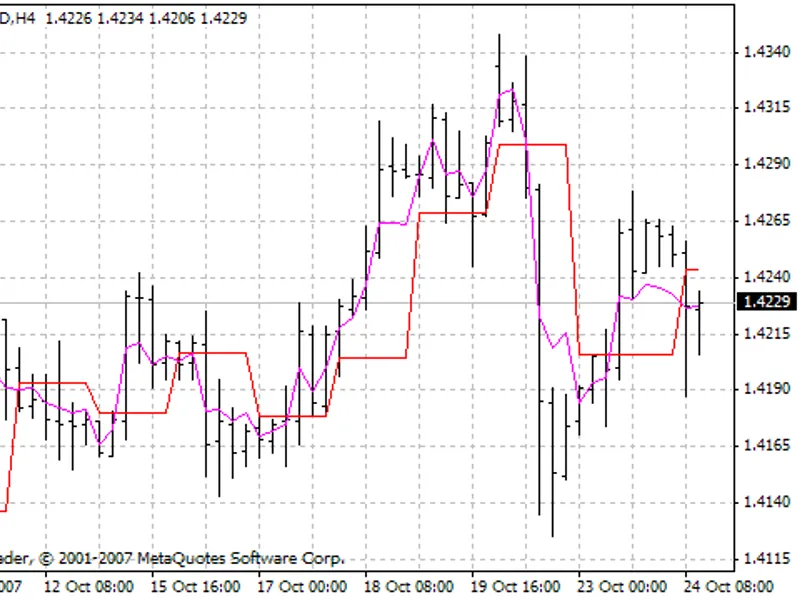
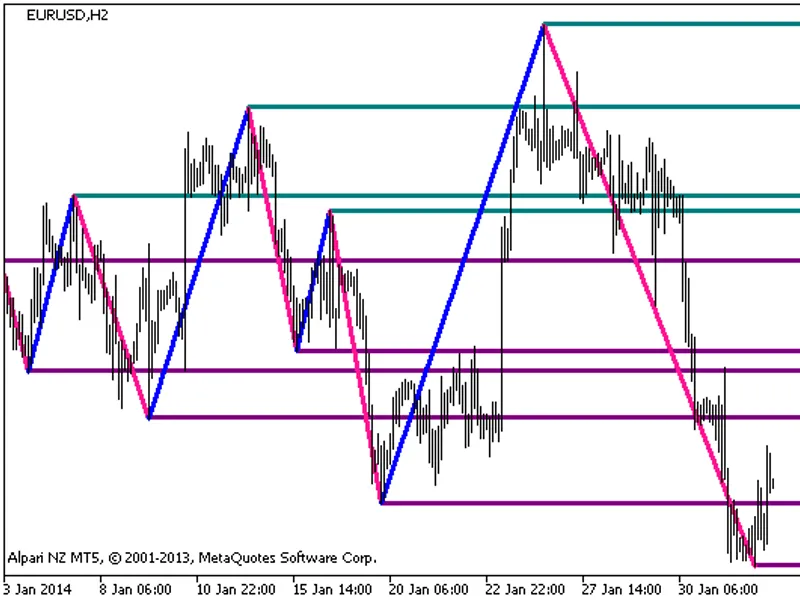
Description & Settings
A set of support and resistance levels built on the last tops of with an option of fixing the timeframe, on which the zigzag is calculated.
To provide correct operation of the indicator, place the compiled ZigZagOnParabolic_HTF.mq5 and ZigZagOnParabolic.mq5 indicator files in terminal_data_folder\MQL5\Indicators.
Figure 1. Indicator ZigZagOnParabolic_HTF_Levels